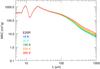
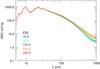
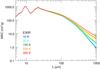
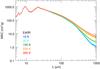
Fig. 5
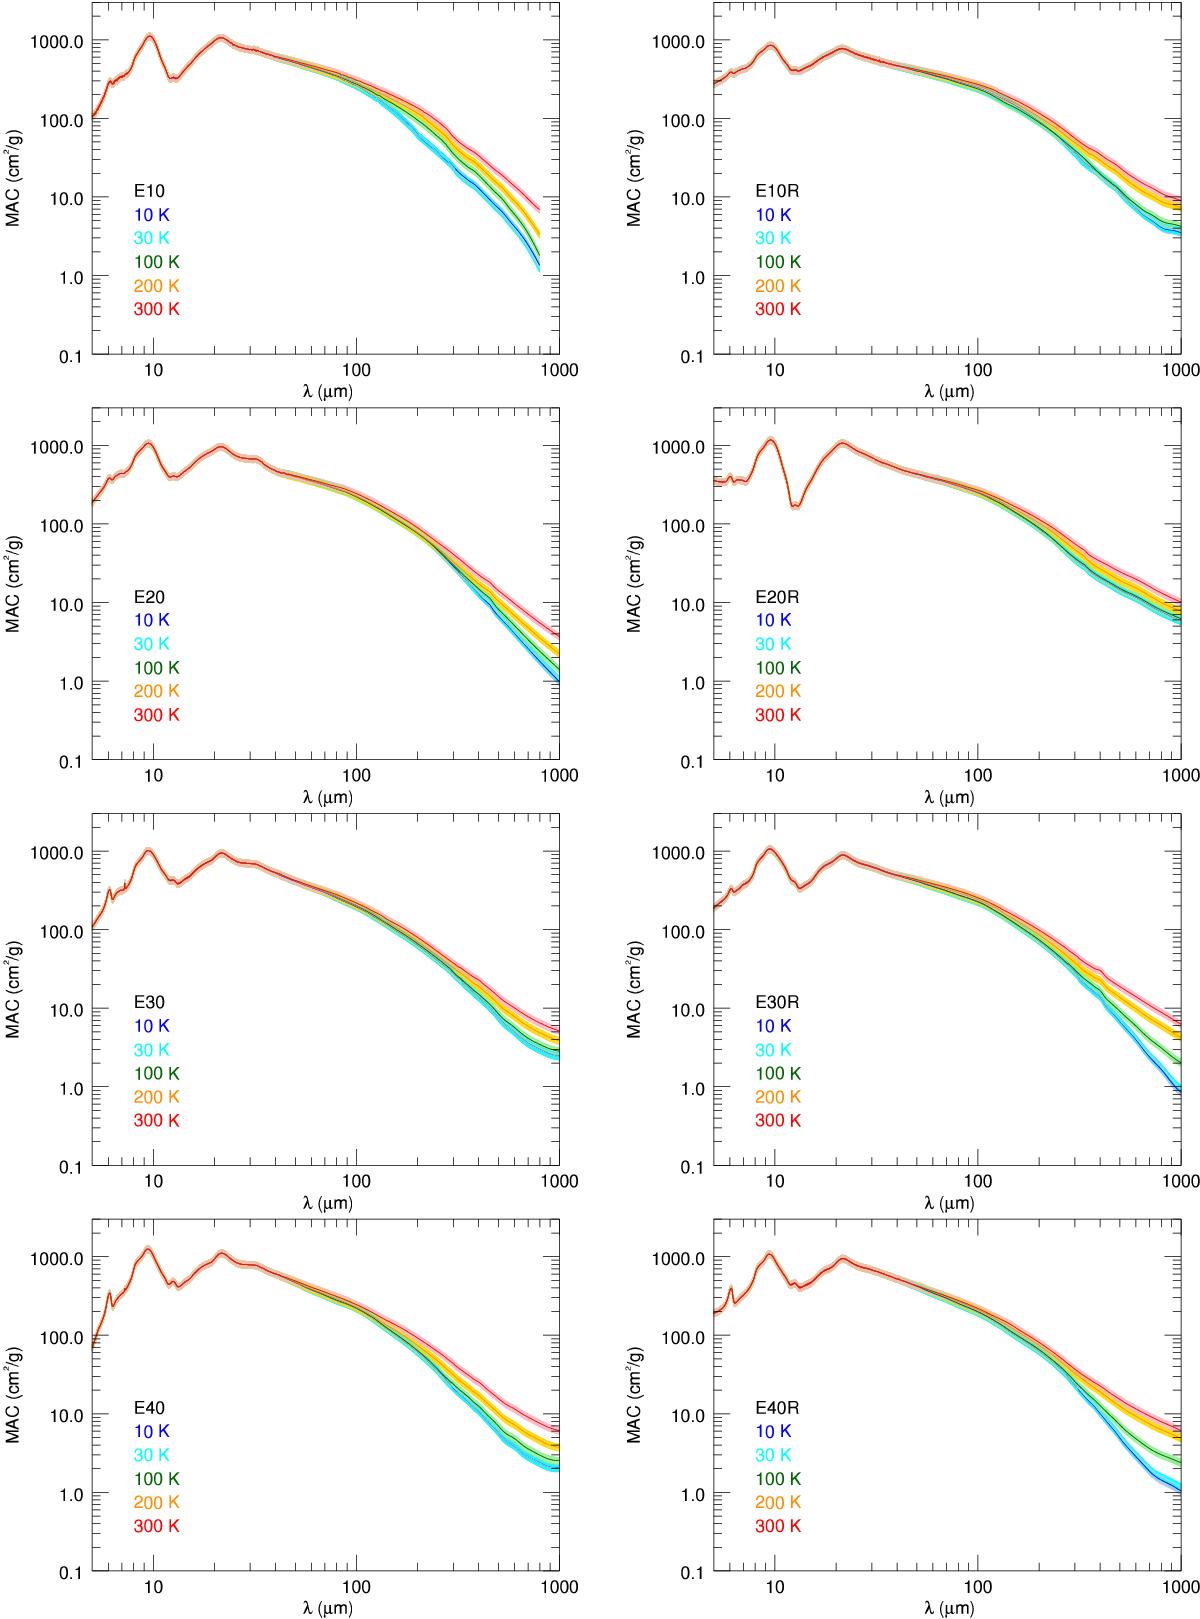
MAC of the Exx and ExxR samples in the 5−1000 μm domain at room temperature (red curve), 200 K (orange), 100 K (yellow), 30 K (light green) and 10 K (blue). The unprocessed samples, Exx, are shown in the left panels (from top to bottom: E10, E20, E30 and E40) and the processed samples, ExxR, in the right panels (from top to bottom: E10R, E20R, E30R and E40R). The shaded area represents the uncertainty on the experimental data.

Current usage metrics show cumulative count of Article Views (full-text article views including HTML views, PDF and ePub downloads, according to the available data) and Abstracts Views on Vision4Press platform.
Data correspond to usage on the plateform after 2015. The current usage metrics is available 48-96 hours after online publication and is updated daily on week days.
Initial download of the metrics may take a while.