Fig. 4
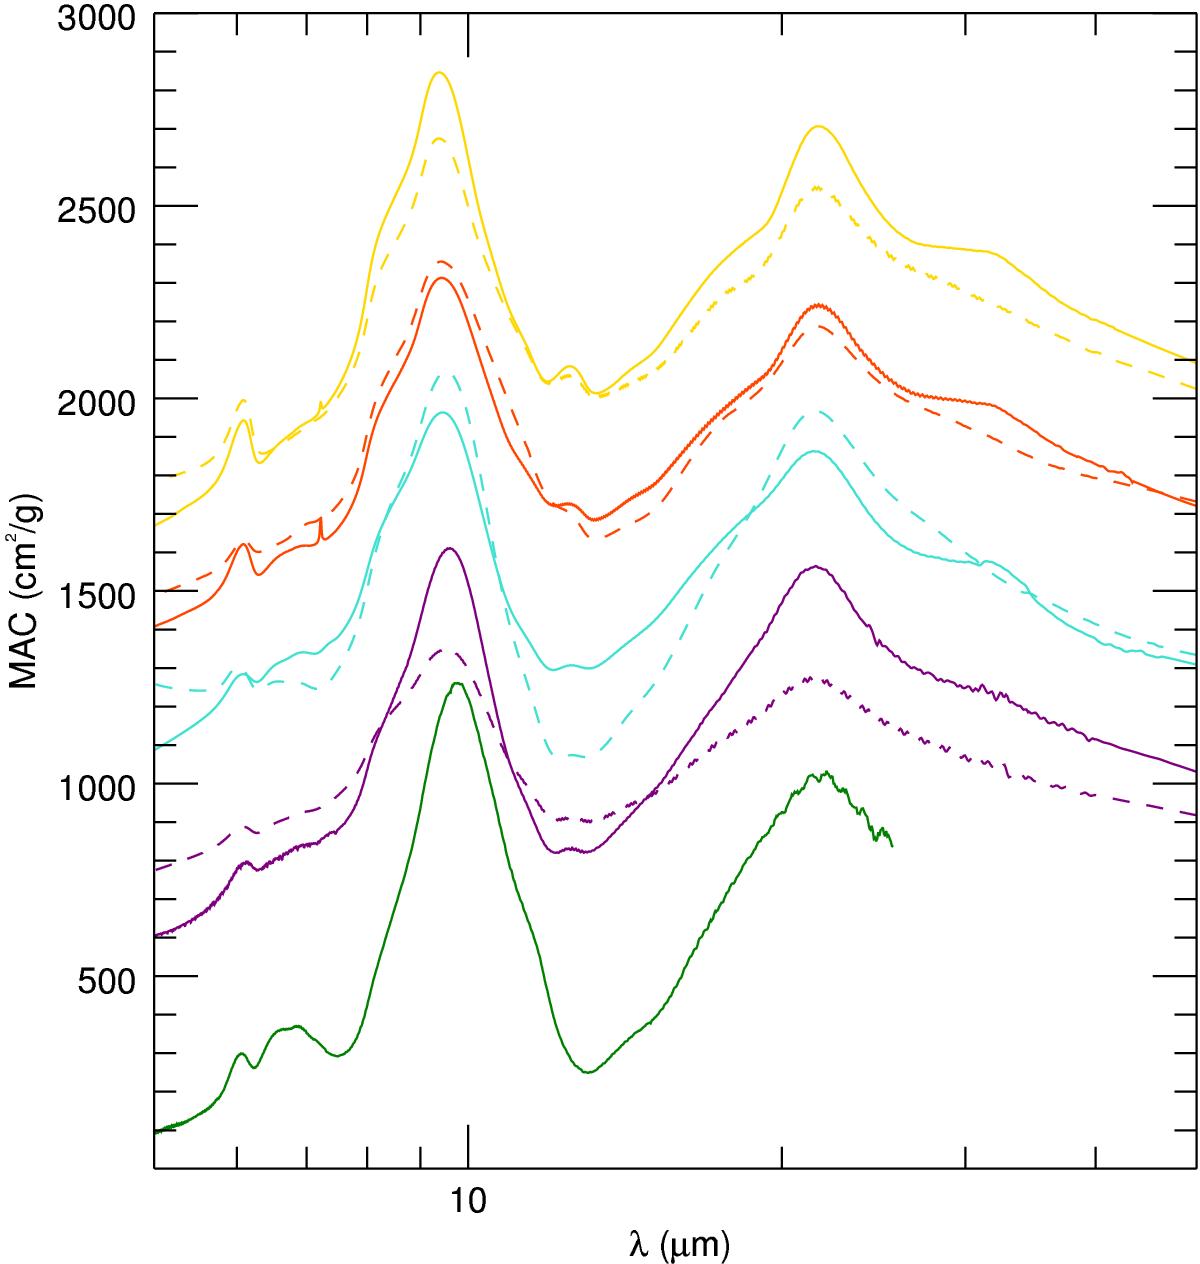
MAC of the samples in the MIR domain at room temperature. The continuous lines designate the samples E10 (purple), E20 (turquoise), E30 (red) and E40 (yellow) while the dashed lines designate the E10R, E20R, E30R and E40R samples (same color). The green curve shows the MAC of the E00 sample from Coupeaud et al. (2011). For the sake of clarity, the MAC curves of the samples E10, E20, E30, E40, E10R, E20R, E30R and E40R have been shifted.
Current usage metrics show cumulative count of Article Views (full-text article views including HTML views, PDF and ePub downloads, according to the available data) and Abstracts Views on Vision4Press platform.
Data correspond to usage on the plateform after 2015. The current usage metrics is available 48-96 hours after online publication and is updated daily on week days.
Initial download of the metrics may take a while.