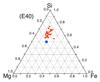
Fig. 3
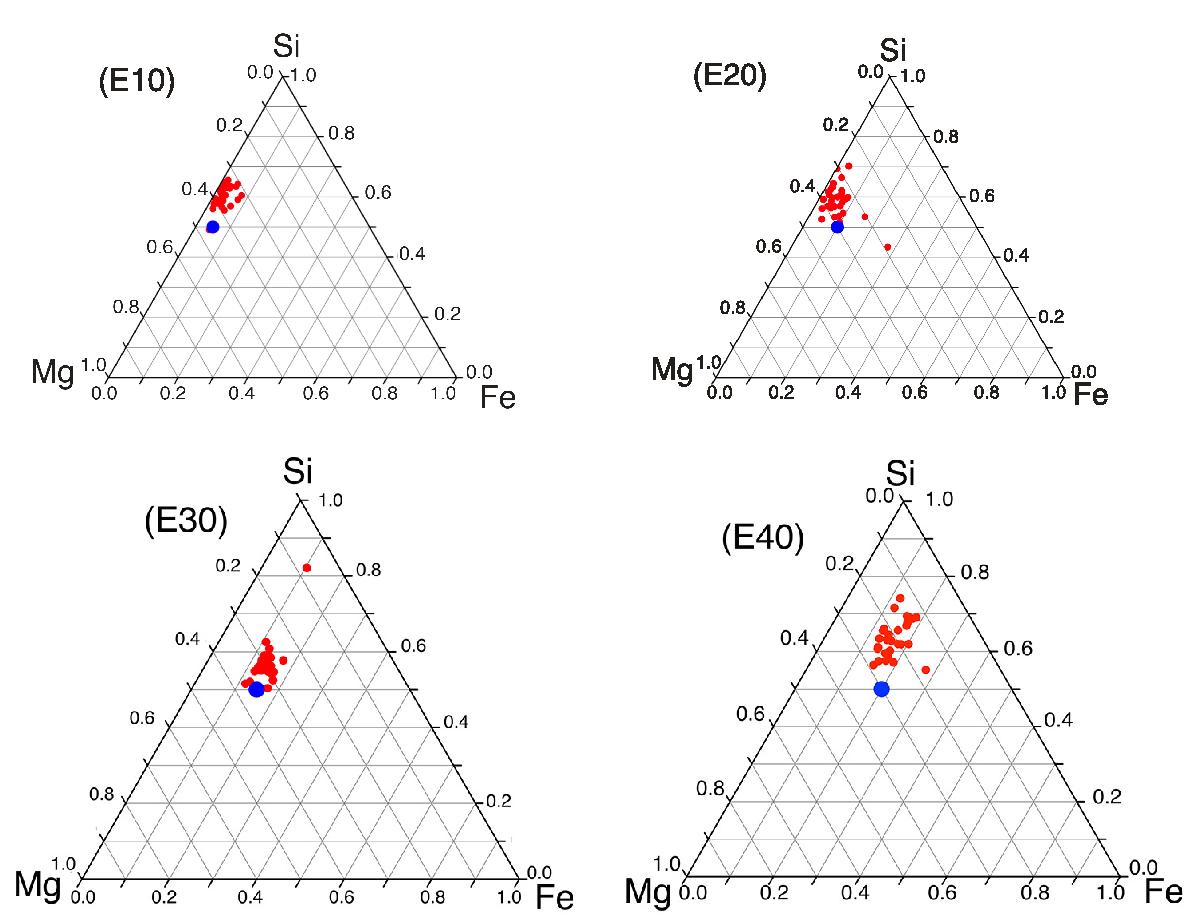
Fe-Mg-Si ternary diagram (at%) showing the composition field of the sol-gel samples, E10 (top left panel), E20 (top right panel), E30 (bottom left panel) and E40 (bottom right panel). Each red point represents an individual analysis with a selected volume of matter of ~10-3μm3. The blue point is the target composition. The slight offset between the target composition and the sol-gel sample is likely due to a small Mg loss under the beam during the analyses.
Current usage metrics show cumulative count of Article Views (full-text article views including HTML views, PDF and ePub downloads, according to the available data) and Abstracts Views on Vision4Press platform.
Data correspond to usage on the plateform after 2015. The current usage metrics is available 48-96 hours after online publication and is updated daily on week days.
Initial download of the metrics may take a while.