Free Access
Fig. 6
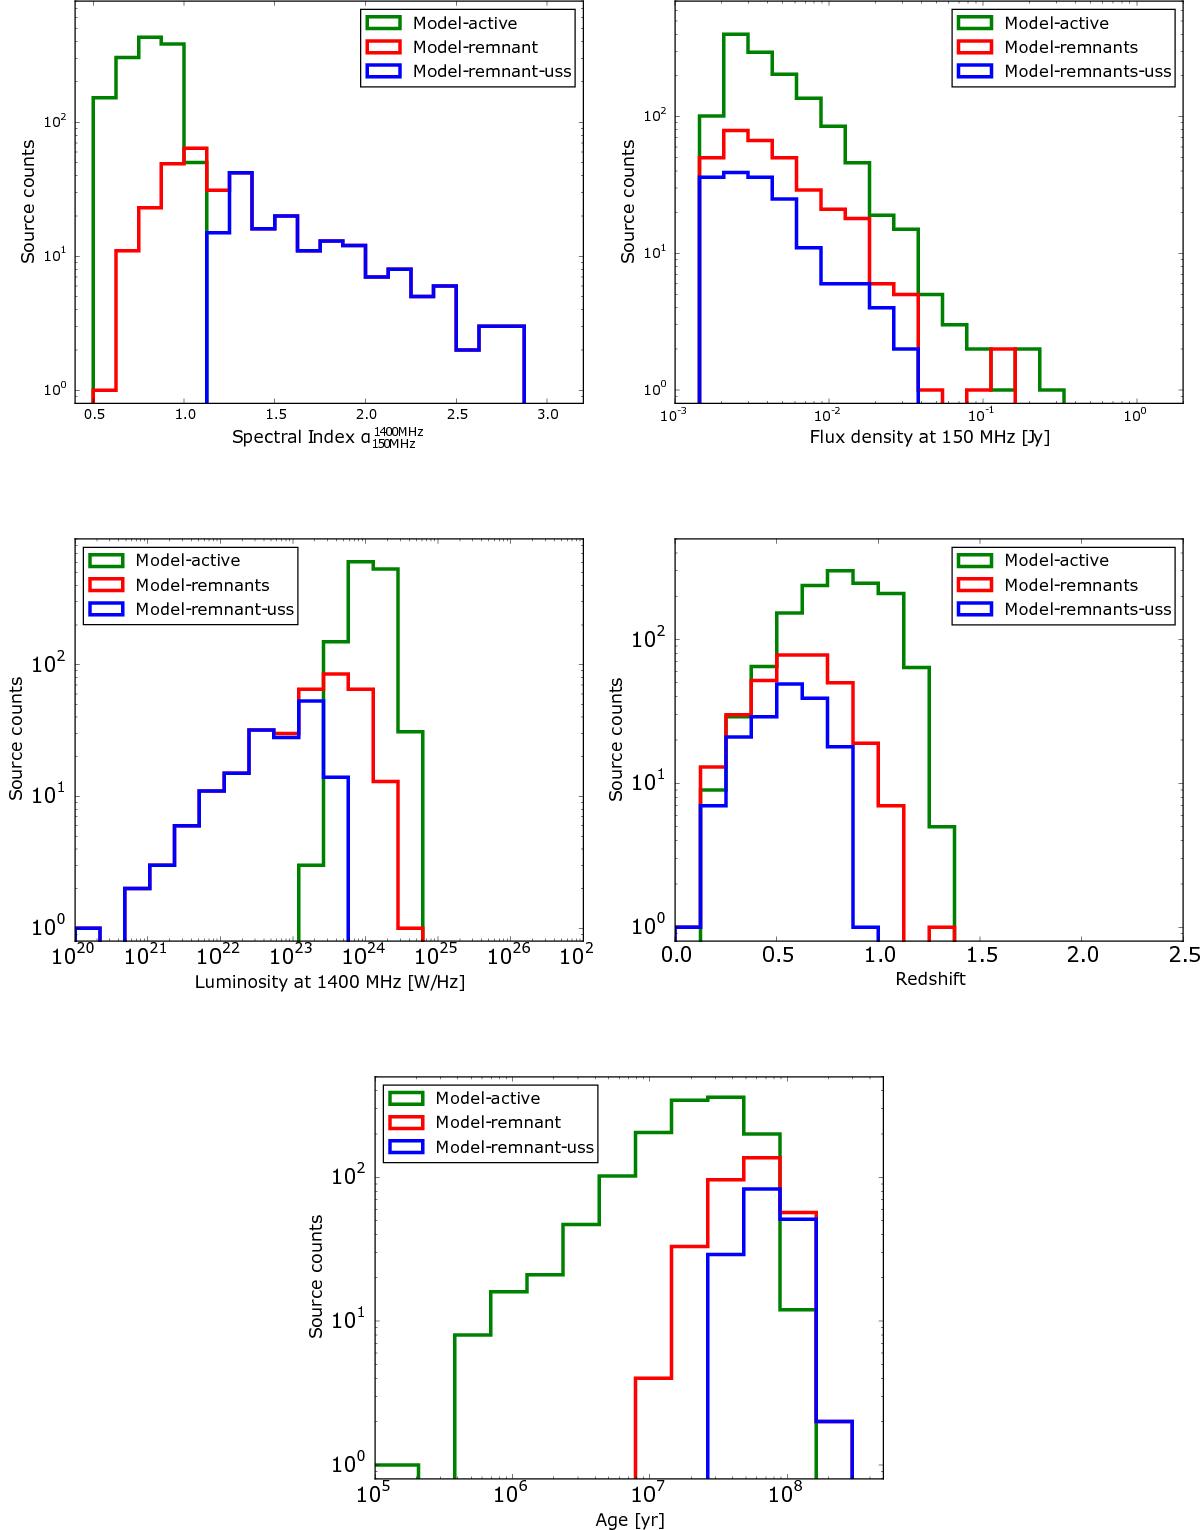
Main output parameters for the mock catalogue produced assuming radiative and dynamical evolution models, as described in Sect. 4.2.2. The green line represents active sources, the red line represents remnant sources, the blue line represents ultra-steep spectrum remnant sources with ![]() .
.
Current usage metrics show cumulative count of Article Views (full-text article views including HTML views, PDF and ePub downloads, according to the available data) and Abstracts Views on Vision4Press platform.
Data correspond to usage on the plateform after 2015. The current usage metrics is available 48-96 hours after online publication and is updated daily on week days.
Initial download of the metrics may take a while.