Fig. 2
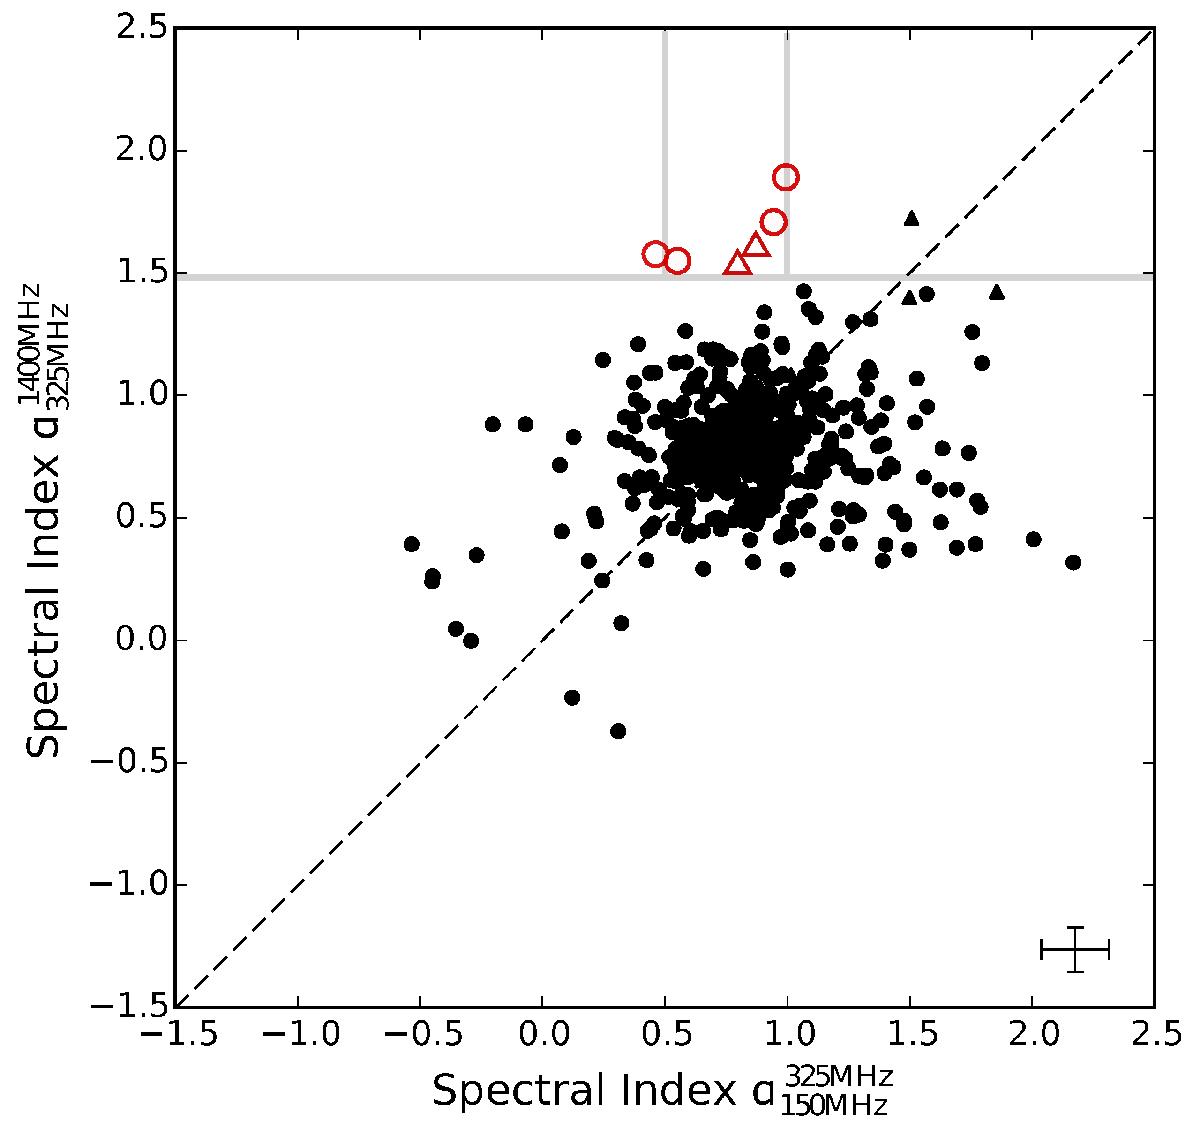
Radio colour-colour plot for sources in the L45NW sample. Triangles represent sources that are not detected in NVSS. Sources that have been selected using the spectral curvature criterion described in Sect. 3.2 are marked with open red symbols. In the bottom right corner a mean error for the points in the plot is show. A black dashed line represents the 1:1 diagonal. Grey lines represent the constraints used for the selection.
Current usage metrics show cumulative count of Article Views (full-text article views including HTML views, PDF and ePub downloads, according to the available data) and Abstracts Views on Vision4Press platform.
Data correspond to usage on the plateform after 2015. The current usage metrics is available 48-96 hours after online publication and is updated daily on week days.
Initial download of the metrics may take a while.