Fig. 9
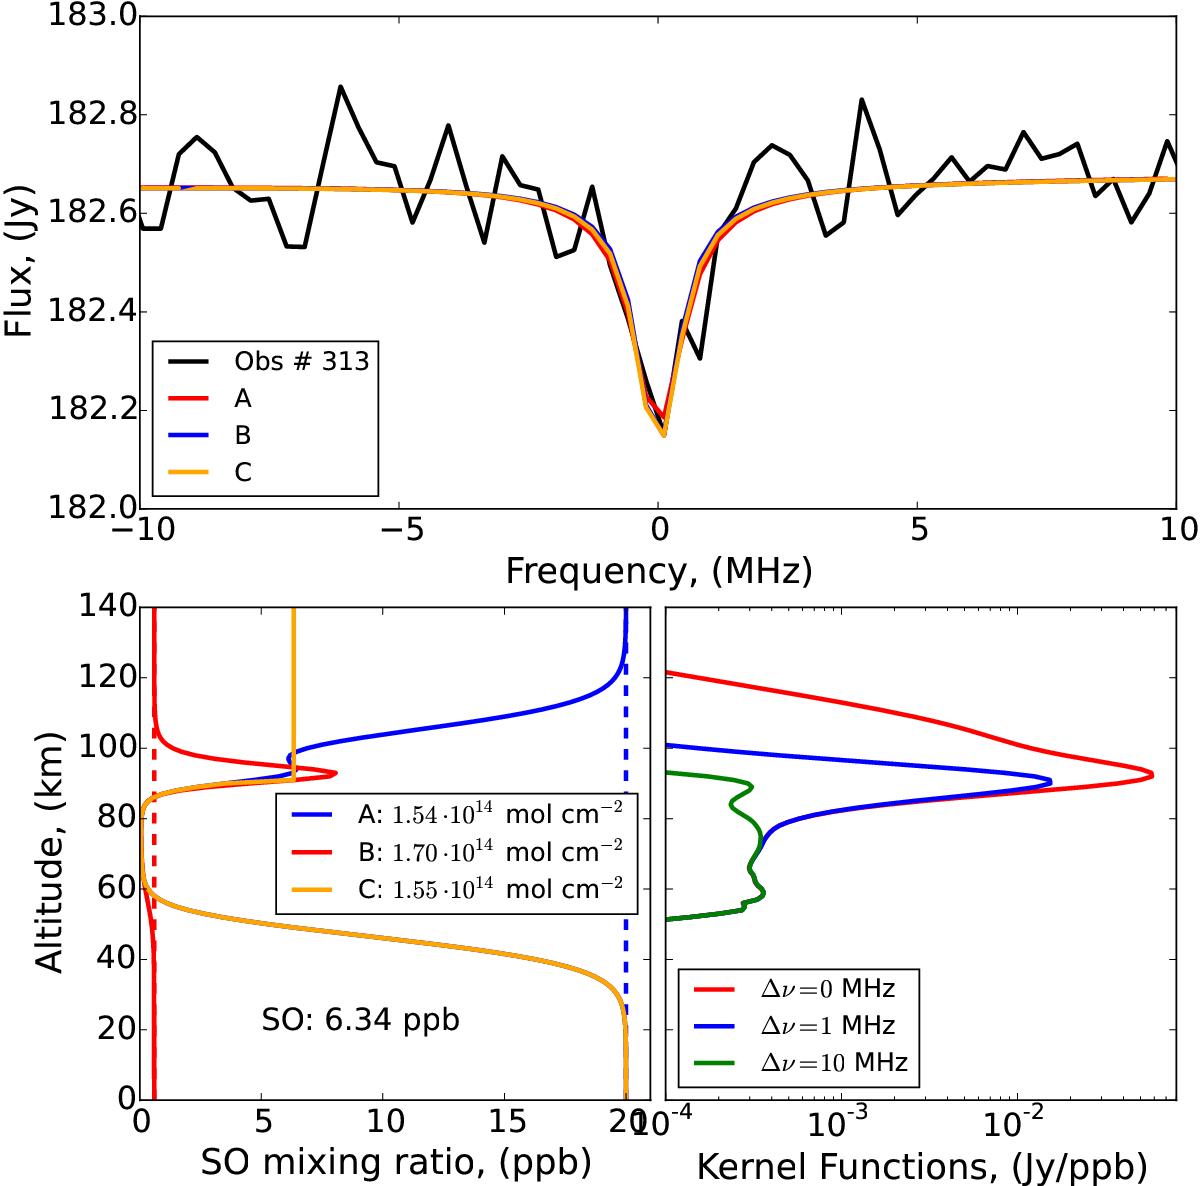
Top: SO spectrum at 346.528 GHz for observation #313 at the disk center on November 15, 2011 (black solid line). Bottom, left: SO profile obtained from the depleted first-guess profile (red). SO profile obtained from the rich first-guess profile (blue). Final SO profile obtained from the intersection of the first two above ~ 90 km (orange). Dashed lines are respectively the depleted (red) and the rich (blue) a priori profiles. Bottom, right: Functional derivatives as function of altitude for observation #313 on November 15, 2011 at frequencies: νi = 346.528 GHz (red line); νi = 346.529 GHz (blue line); νi = 346.538 GHz (green line).
Current usage metrics show cumulative count of Article Views (full-text article views including HTML views, PDF and ePub downloads, according to the available data) and Abstracts Views on Vision4Press platform.
Data correspond to usage on the plateform after 2015. The current usage metrics is available 48-96 hours after online publication and is updated daily on week days.
Initial download of the metrics may take a while.