Fig. 6
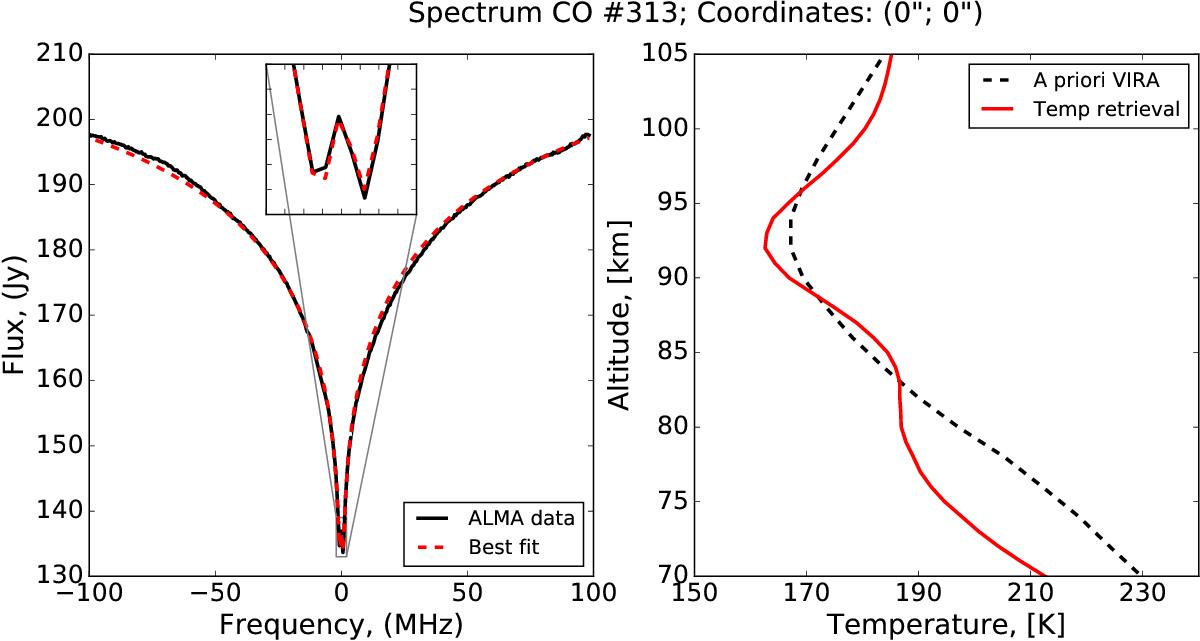
Left: CO ALMA spectrum at 345.7960 GHz for observation #313 at the disk center (black solid line) on November 14, 2011. We over-plotted a synthetic spectrum (red dotted line) obtained using the nominal CO profile of Fig. 5 (orange line) and the retrieved temperature profile (red solid line) on the right panel. Right: Retrieved temperature profile (red solid line) as function of altitude. VIRA day side temperature profile (black dotted line) used as a priori is also displayed.
Current usage metrics show cumulative count of Article Views (full-text article views including HTML views, PDF and ePub downloads, according to the available data) and Abstracts Views on Vision4Press platform.
Data correspond to usage on the plateform after 2015. The current usage metrics is available 48-96 hours after online publication and is updated daily on week days.
Initial download of the metrics may take a while.