Fig. A.3
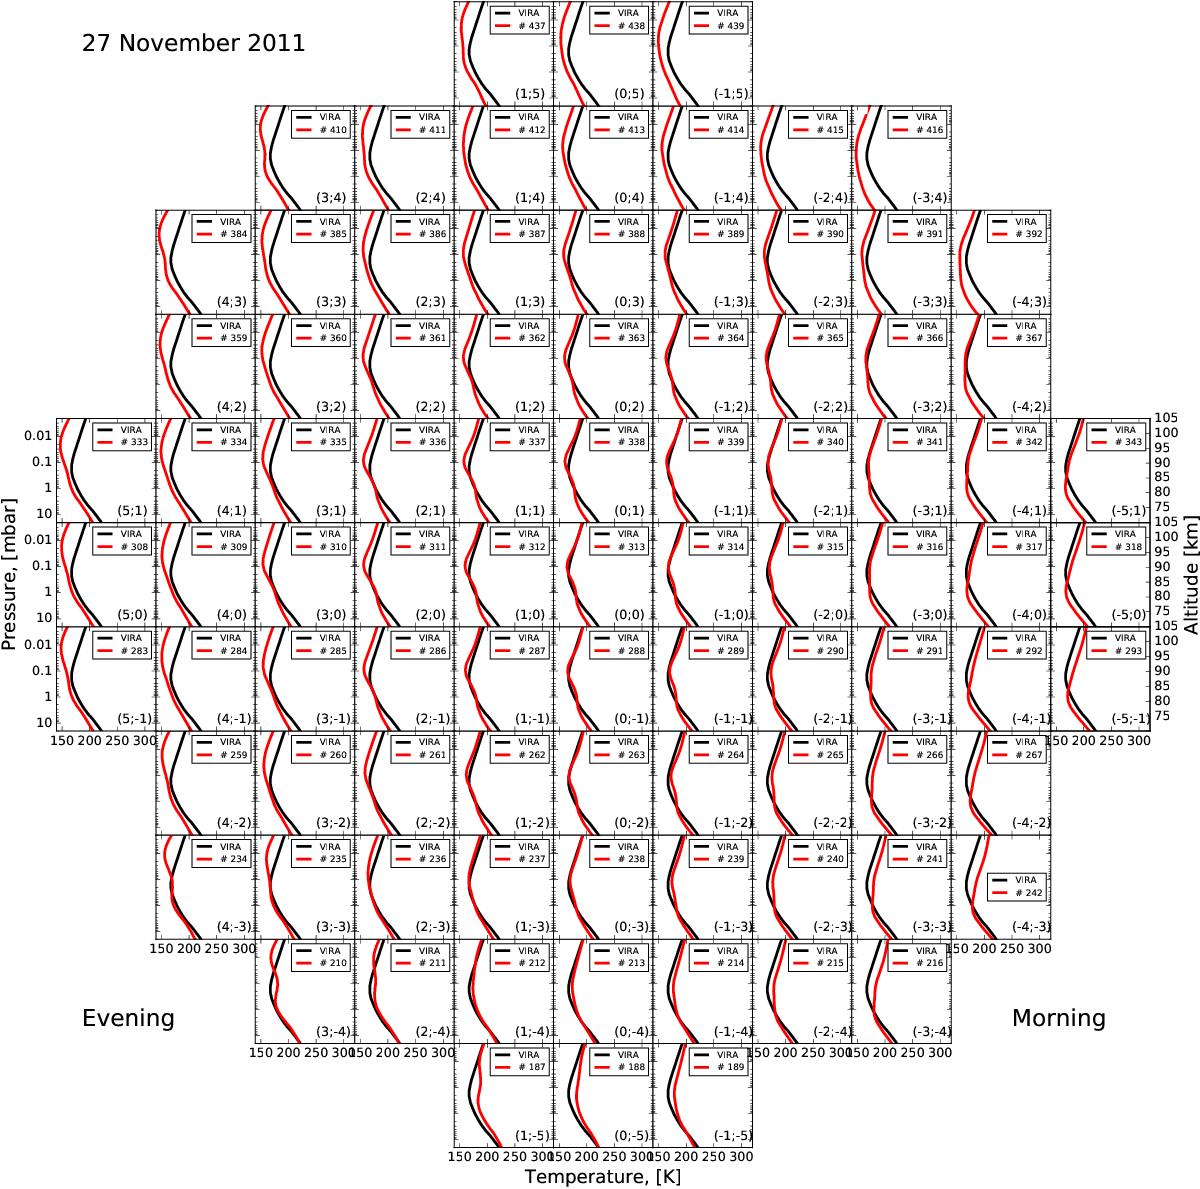
Map of temperature retrievals (red lines) as function of pressure for November 27, 2011. The black line correspond to the VIRA temperature profile. The right limb corresponds to the morning at local time 9 h, and the left limb corresponds to the evening at local time 19 h. The altitude scale on the right is approximate. Numbers in parentheses are the angular offsets relative to the planet center (ΔX, ΔY in arcsec).
Current usage metrics show cumulative count of Article Views (full-text article views including HTML views, PDF and ePub downloads, according to the available data) and Abstracts Views on Vision4Press platform.
Data correspond to usage on the plateform after 2015. The current usage metrics is available 48-96 hours after online publication and is updated daily on week days.
Initial download of the metrics may take a while.