Fig. 17
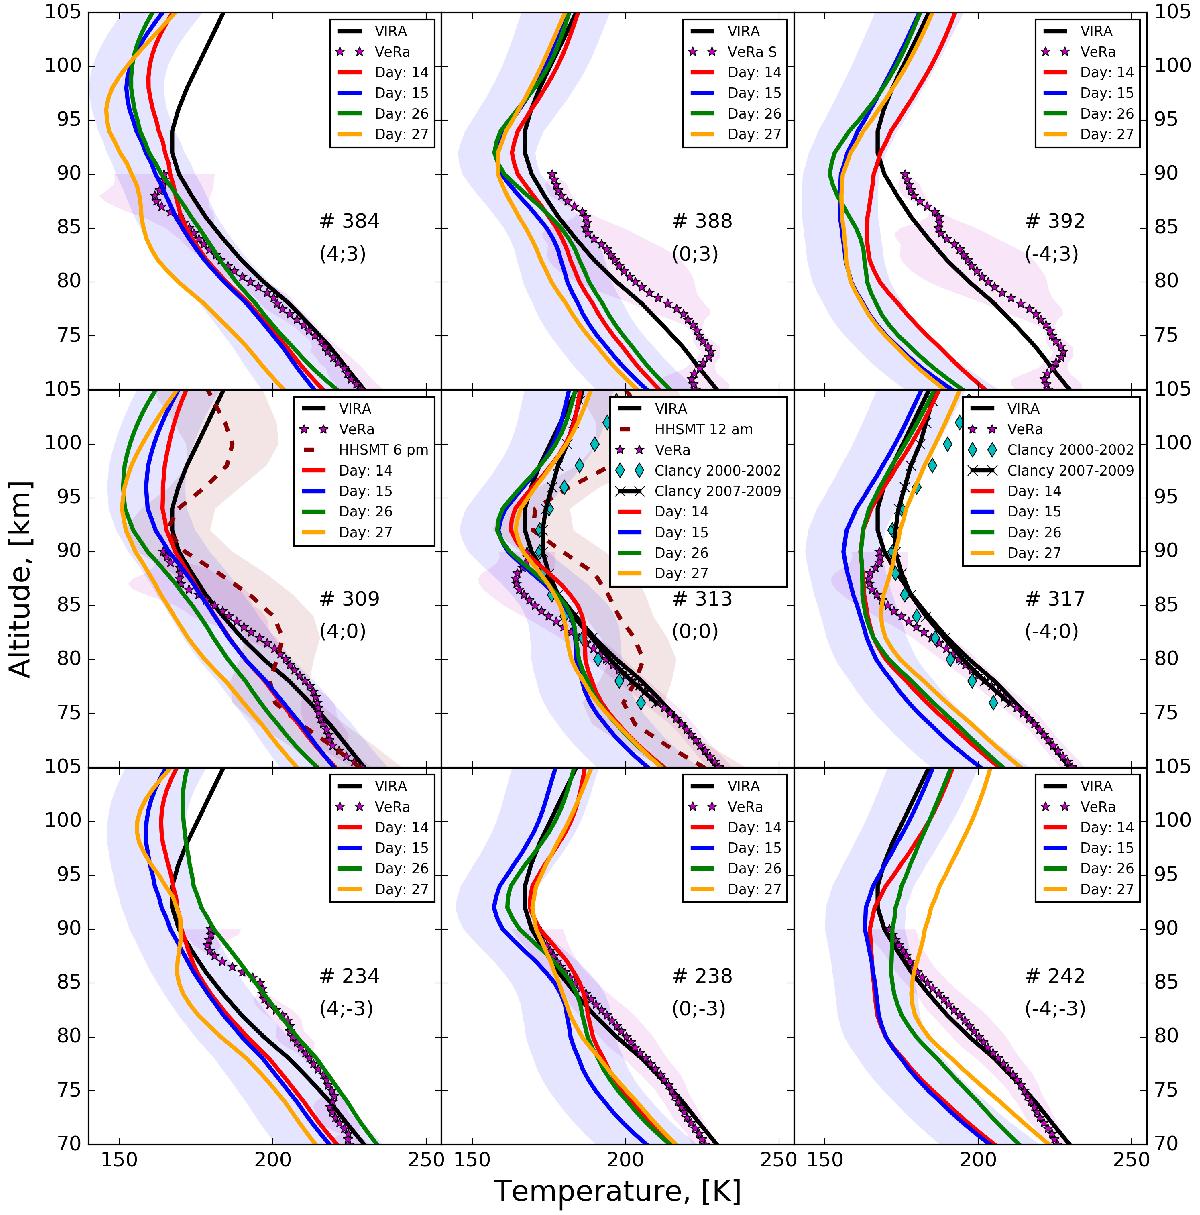
ALMA vertical temperature profiles for the four days of observation at six different locations and local times (see Fig. 12). The VIRA (Seiff et al. 1985) models is indicated by solid black line. Vertical temperature profiles acquired by HHSMT ground-based measurements (purple dashed line) (Rengel et al. 2008a) and by the radio-occultation experiment VeRa/VEx (magenta star symbols) are shown (Tellmann et al. 2009). Sub-mm ground-based observations are also displayed: cyan diamond (2000−2002 profile) and star symbols (2007−2009 profile) (Clancy et al. 2012). The colored area marks the uncertainty of temperature profiles.
Current usage metrics show cumulative count of Article Views (full-text article views including HTML views, PDF and ePub downloads, according to the available data) and Abstracts Views on Vision4Press platform.
Data correspond to usage on the plateform after 2015. The current usage metrics is available 48-96 hours after online publication and is updated daily on week days.
Initial download of the metrics may take a while.