Fig. 14
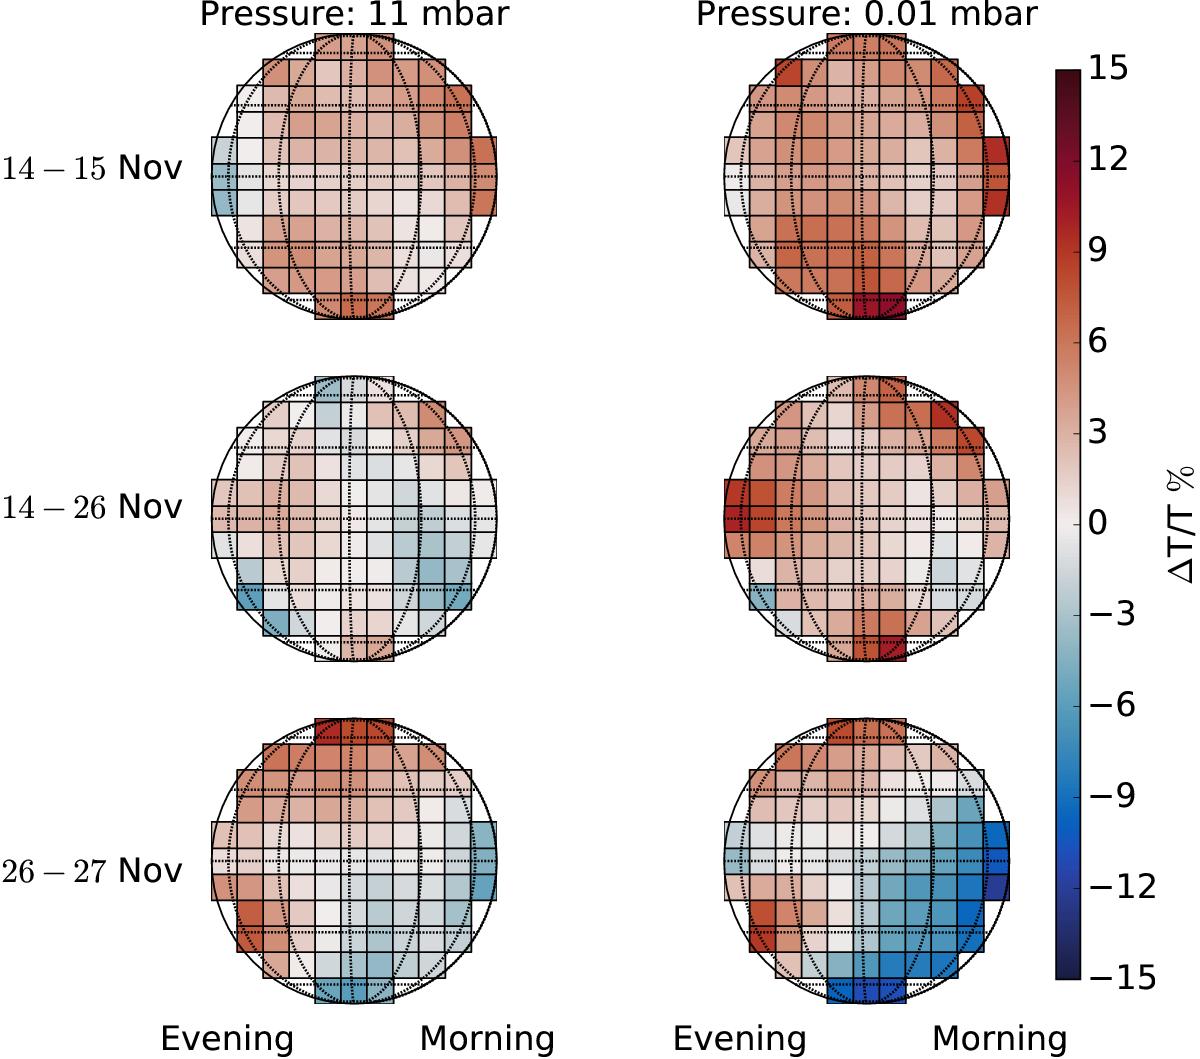
Global maps of ALMA observation at two different pressure levels: 11 mbar (~ 74 km) and 0.01 mbar (~ 100 km). Colorbar shows the normalized percentage difference between selected pair of days: top: the first day and the second day of ALMA vertical temperature profiles; middle: the first and the third day; and bottom: the third and the fourth day of observation, as indicated in the figure. The absolute temperature uncertainties is 8%, as indicated in Table 3.
Current usage metrics show cumulative count of Article Views (full-text article views including HTML views, PDF and ePub downloads, according to the available data) and Abstracts Views on Vision4Press platform.
Data correspond to usage on the plateform after 2015. The current usage metrics is available 48-96 hours after online publication and is updated daily on week days.
Initial download of the metrics may take a while.