Fig. 11
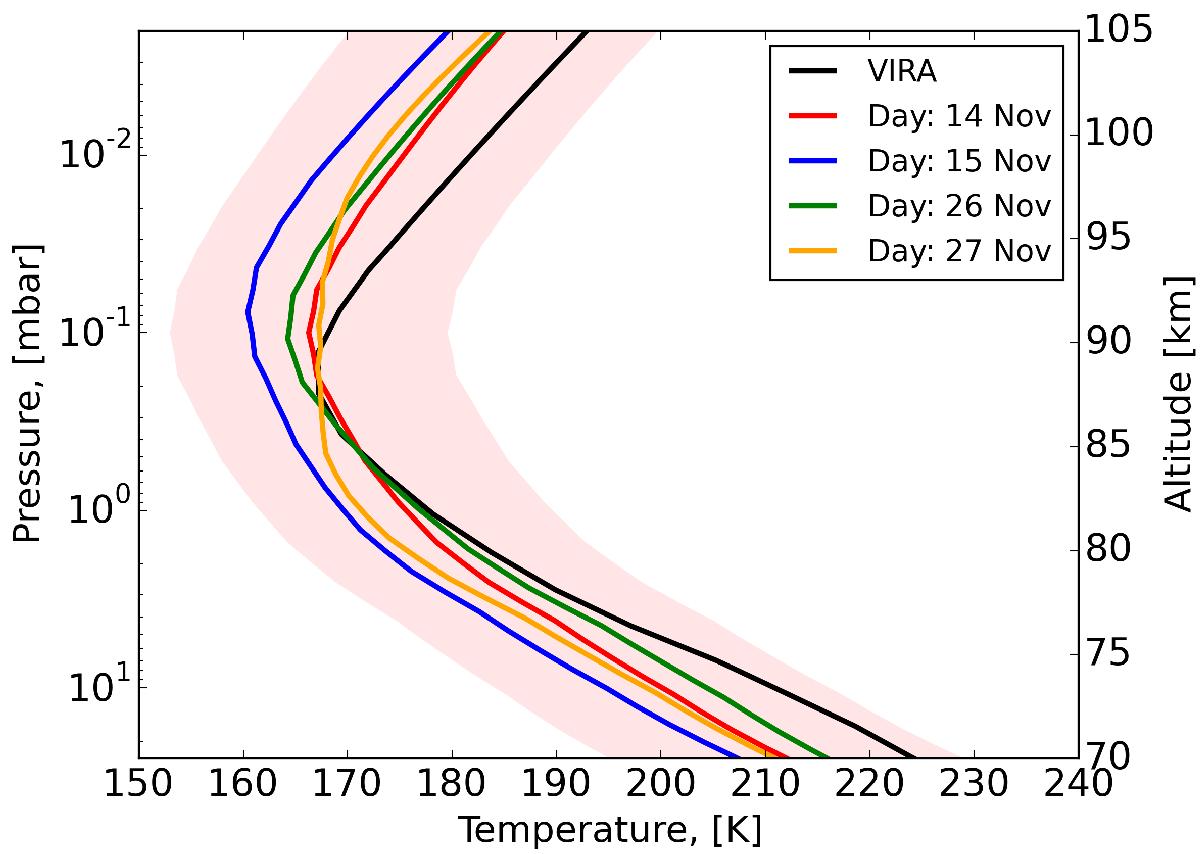
Retrieved temperature profiles derived from the CO spectra integrated over the disk for the four days of observation: (red) November 14; (blue) November 15; (green) November 26; (orange) November 27. In black is plotted the VIRA temperature profile as reference. The colored area marks the uncertainty of the November 14 temperature profile.
Current usage metrics show cumulative count of Article Views (full-text article views including HTML views, PDF and ePub downloads, according to the available data) and Abstracts Views on Vision4Press platform.
Data correspond to usage on the plateform after 2015. The current usage metrics is available 48-96 hours after online publication and is updated daily on week days.
Initial download of the metrics may take a while.