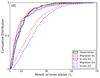
Fig. 4
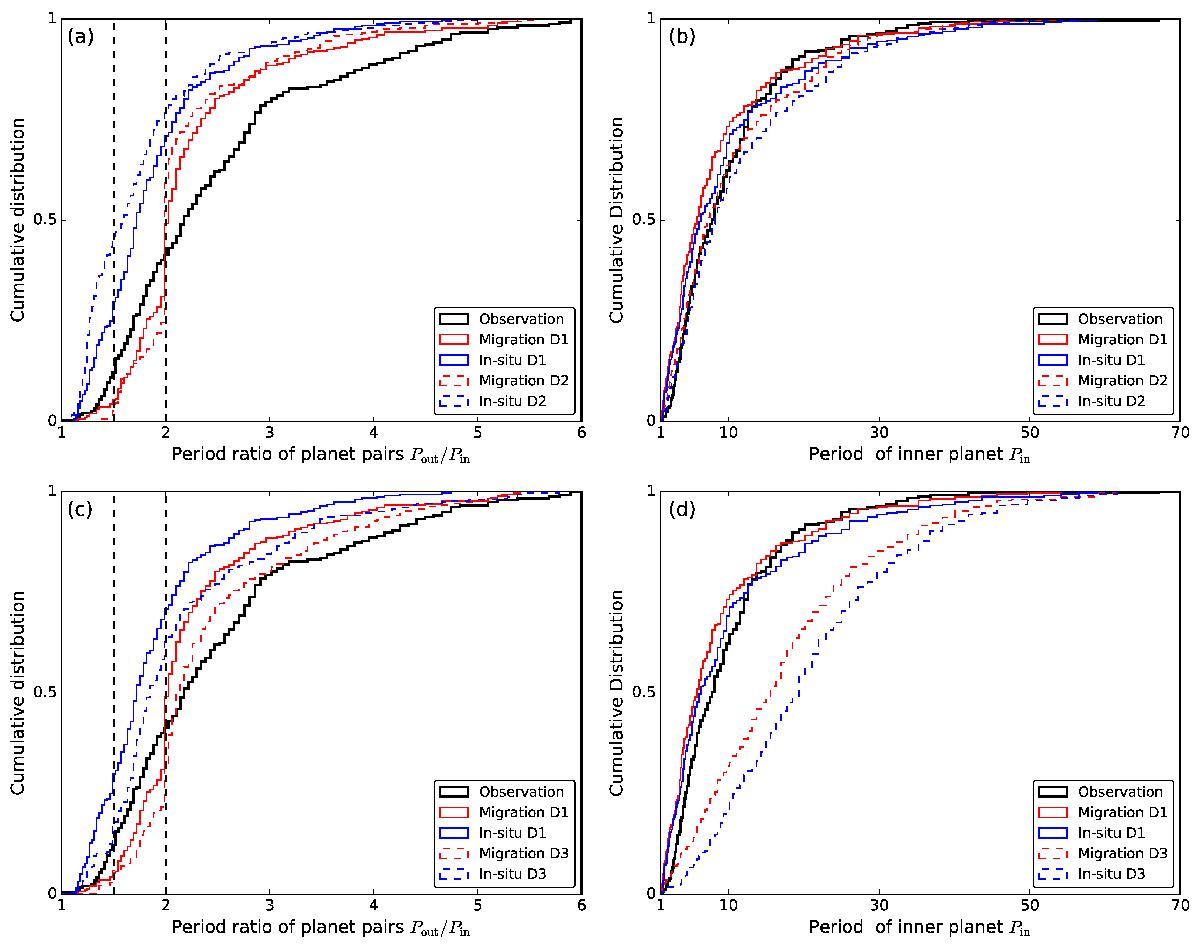
Cumulative distribution of planet period ratio (left) and inner planet period (right). The black solid line represents the observations, whereas the red and blue lines show the results from the migration and the in-situ scenarios, respectively. The solid lines are the result of D1 in all four panels. Dashed lines give the results of D2 in panels a and b, and D3 in panels c and d, respectively. Vertical lines mark the 3:2 and 2:1 MMRs.
Current usage metrics show cumulative count of Article Views (full-text article views including HTML views, PDF and ePub downloads, according to the available data) and Abstracts Views on Vision4Press platform.
Data correspond to usage on the plateform after 2015. The current usage metrics is available 48-96 hours after online publication and is updated daily on week days.
Initial download of the metrics may take a while.