Fig. 3
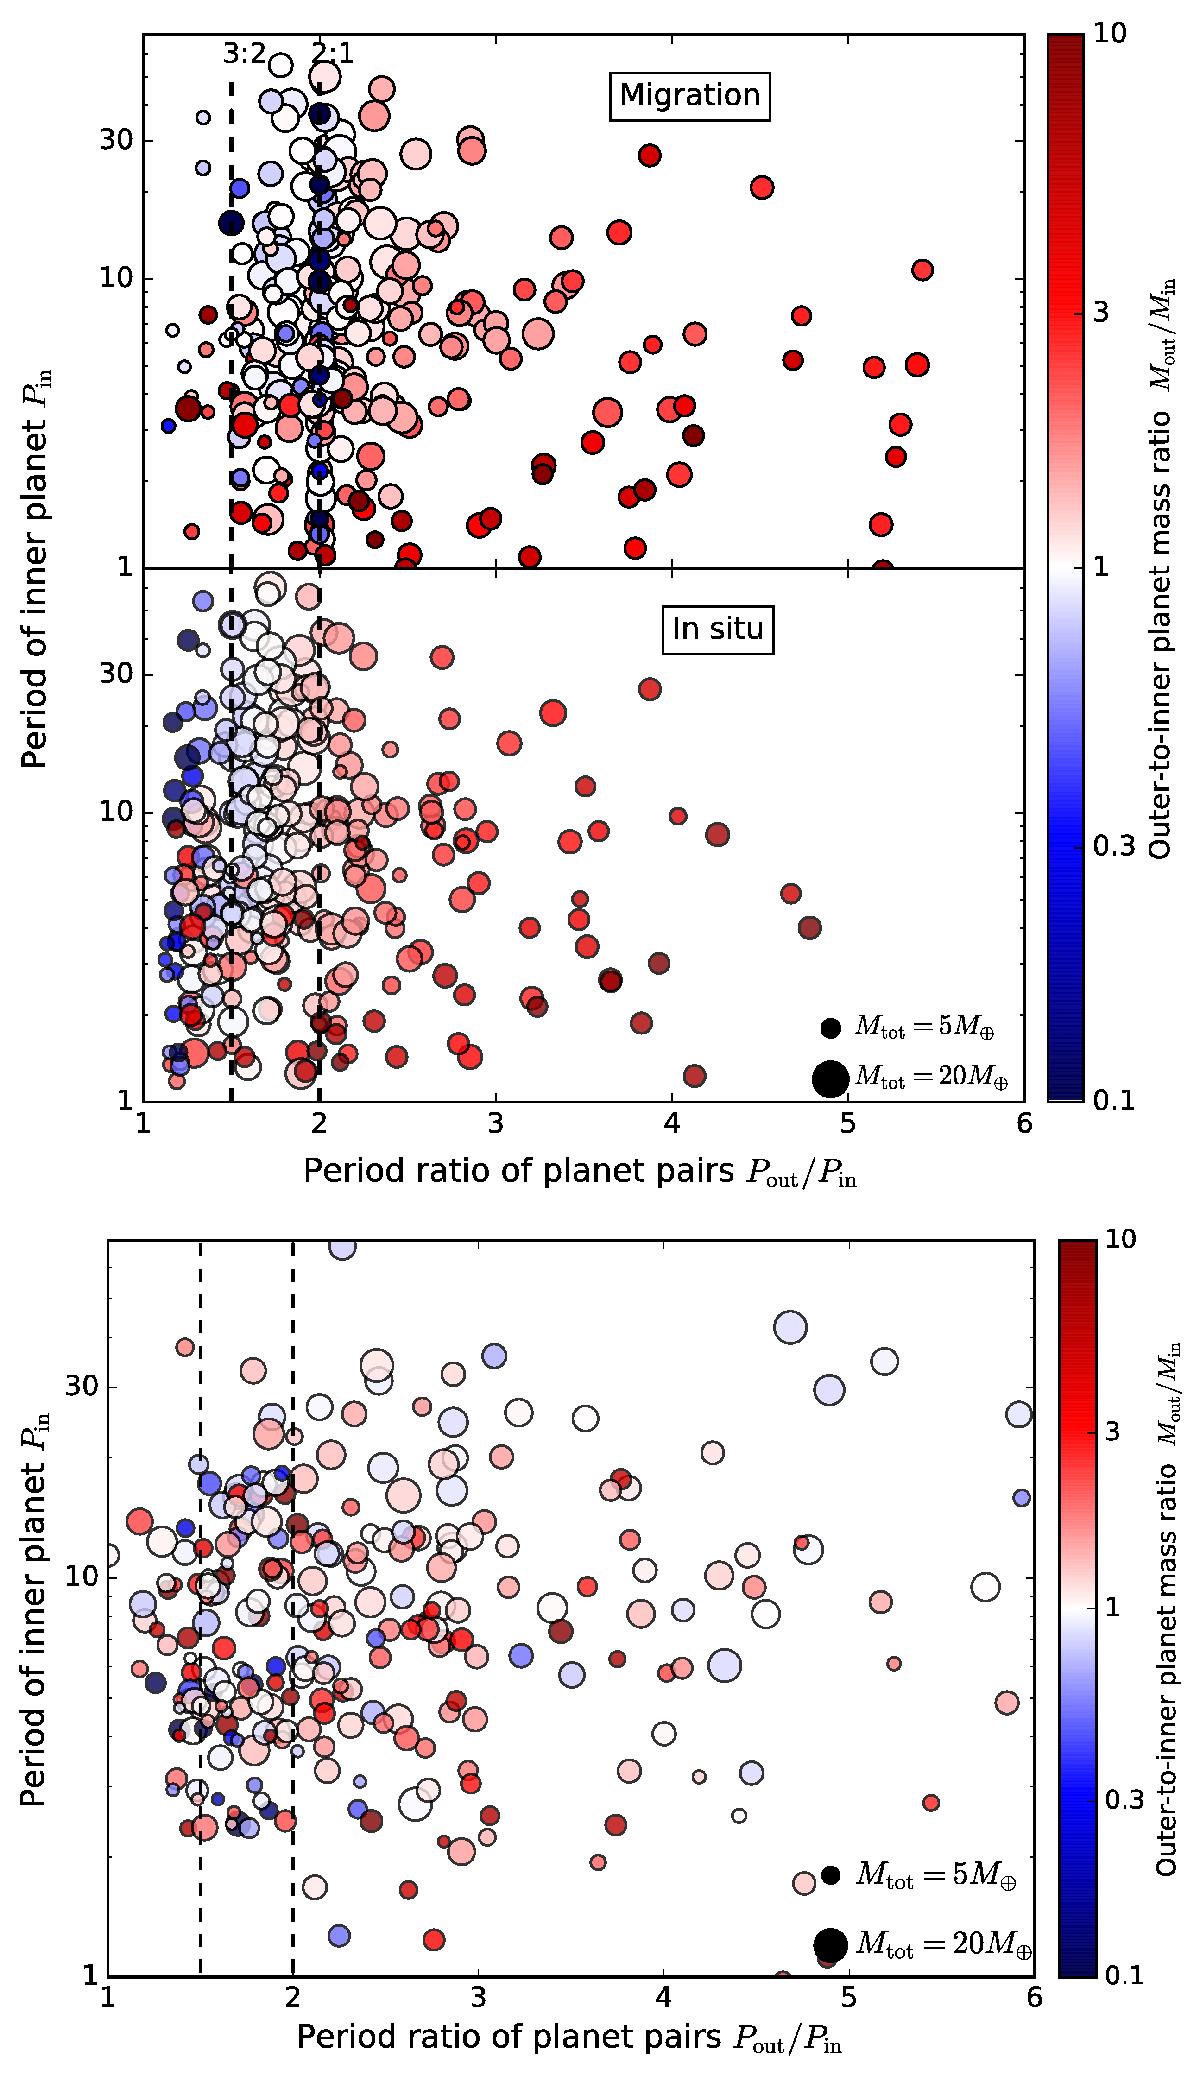
Scatter plot of the inner planet period and the outer-to-inner period ratio from simulations (upper panel) and from our Kepler sample (lower panel). The size of the dot indicates the total mass of planets in an individual system, and the color (blue to red) corresponds to their outer-to-inner mass ratio (small to large). The masses of planets are calculated from their radii by Weiss & Marcy (2014).
Current usage metrics show cumulative count of Article Views (full-text article views including HTML views, PDF and ePub downloads, according to the available data) and Abstracts Views on Vision4Press platform.
Data correspond to usage on the plateform after 2015. The current usage metrics is available 48-96 hours after online publication and is updated daily on week days.
Initial download of the metrics may take a while.