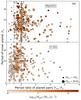
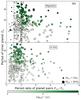
Fig. 2
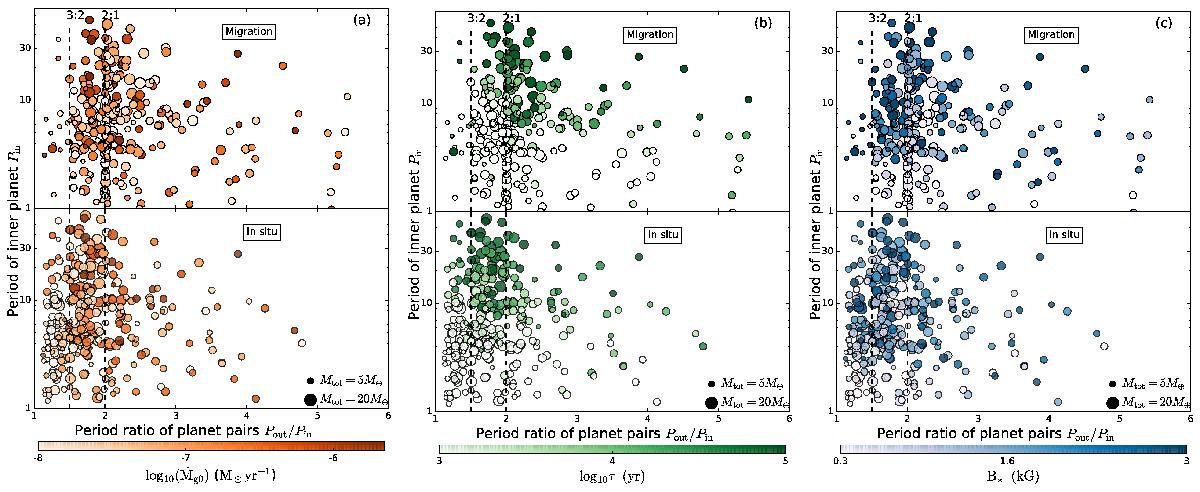
Scatter plot of the inner planet period and the outer-to-inner planet period ratio. Each dot represents the final state of one particular planetary system. The color of the dot corresponds to Ṁg0 (orange in panel a), τd (green in panel b), or B⋆ (blue in panel c), respectively. The size of the dot represents the total mass of two planets. Vertical lines mark the 2:1 and 3:2 MMRs.
Current usage metrics show cumulative count of Article Views (full-text article views including HTML views, PDF and ePub downloads, according to the available data) and Abstracts Views on Vision4Press platform.
Data correspond to usage on the plateform after 2015. The current usage metrics is available 48-96 hours after online publication and is updated daily on week days.
Initial download of the metrics may take a while.