Fig. 1
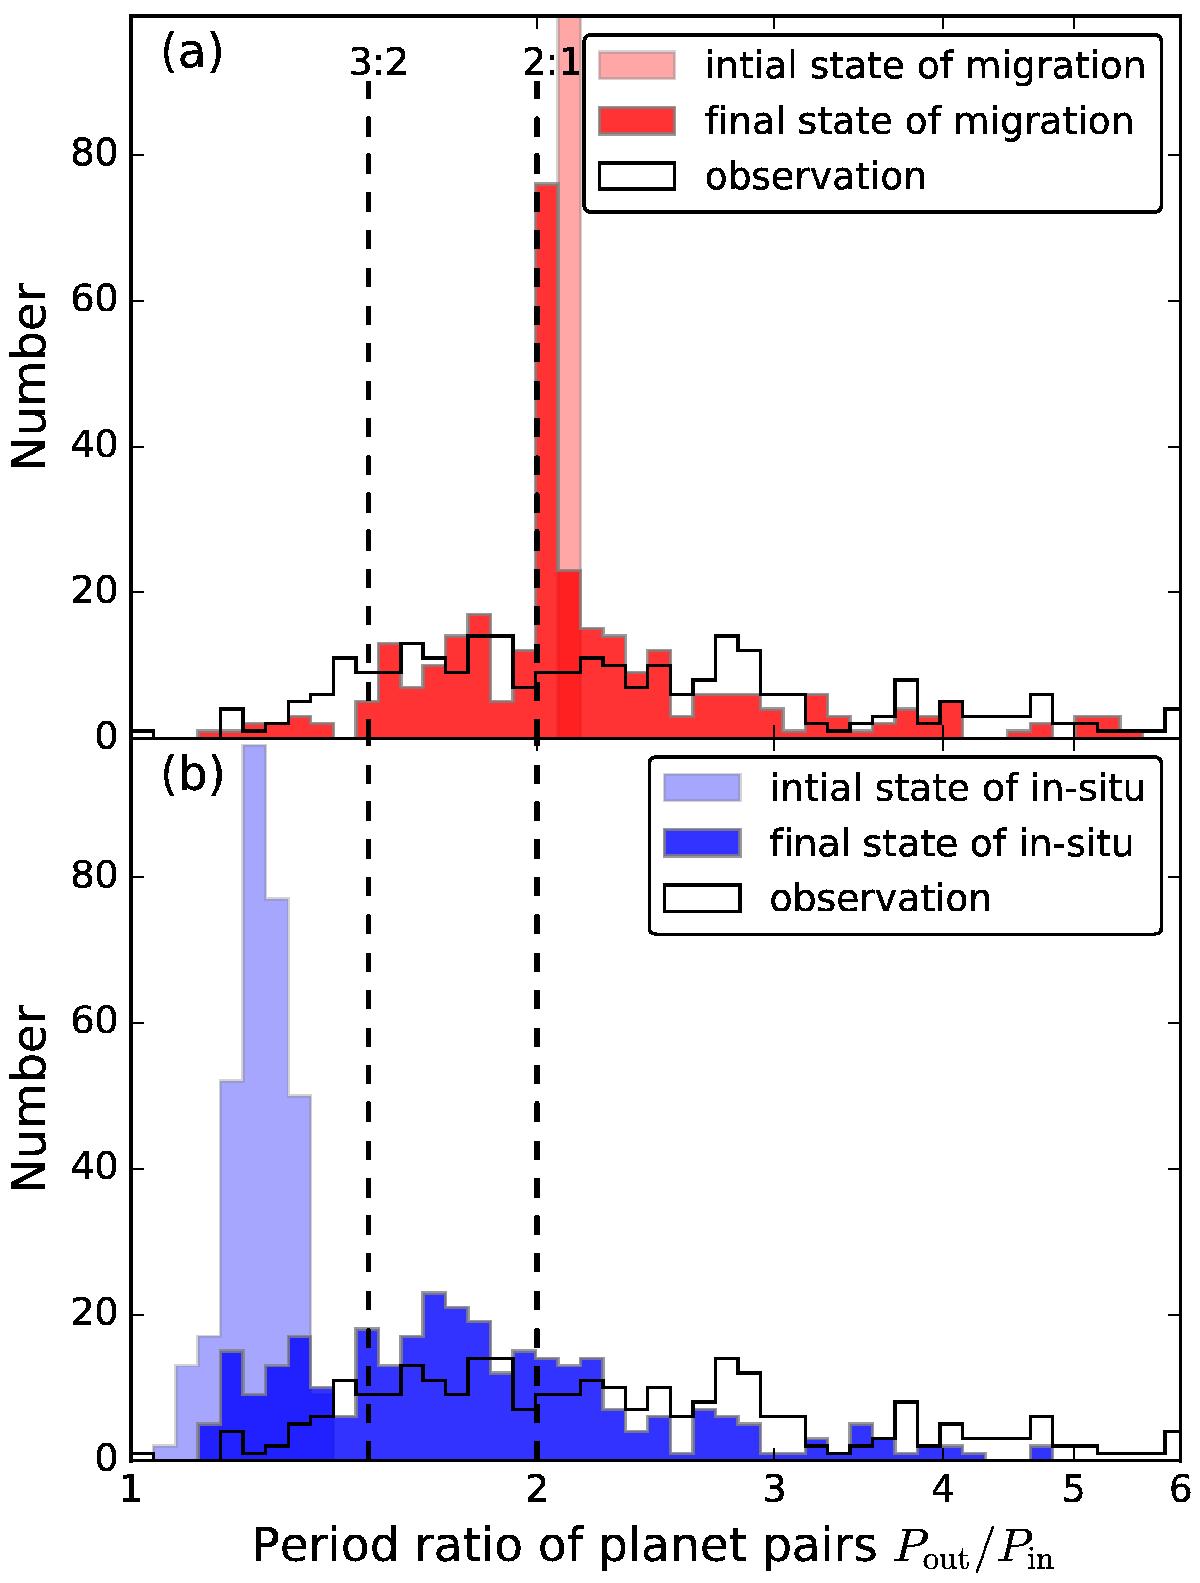
Histogram of the outer-to-inner planet period ratio. The upper and lower panel show the results from the migration (red) and the in-situ (blue) scenario, respectively. In each scenario, both the initial (light) and final states (dark) of the simulations are given. The black line is the observation data for comparison. Vertical lines indicate the 2:1 and 3:2 MMRs.
Current usage metrics show cumulative count of Article Views (full-text article views including HTML views, PDF and ePub downloads, according to the available data) and Abstracts Views on Vision4Press platform.
Data correspond to usage on the plateform after 2015. The current usage metrics is available 48-96 hours after online publication and is updated daily on week days.
Initial download of the metrics may take a while.