Fig. 5
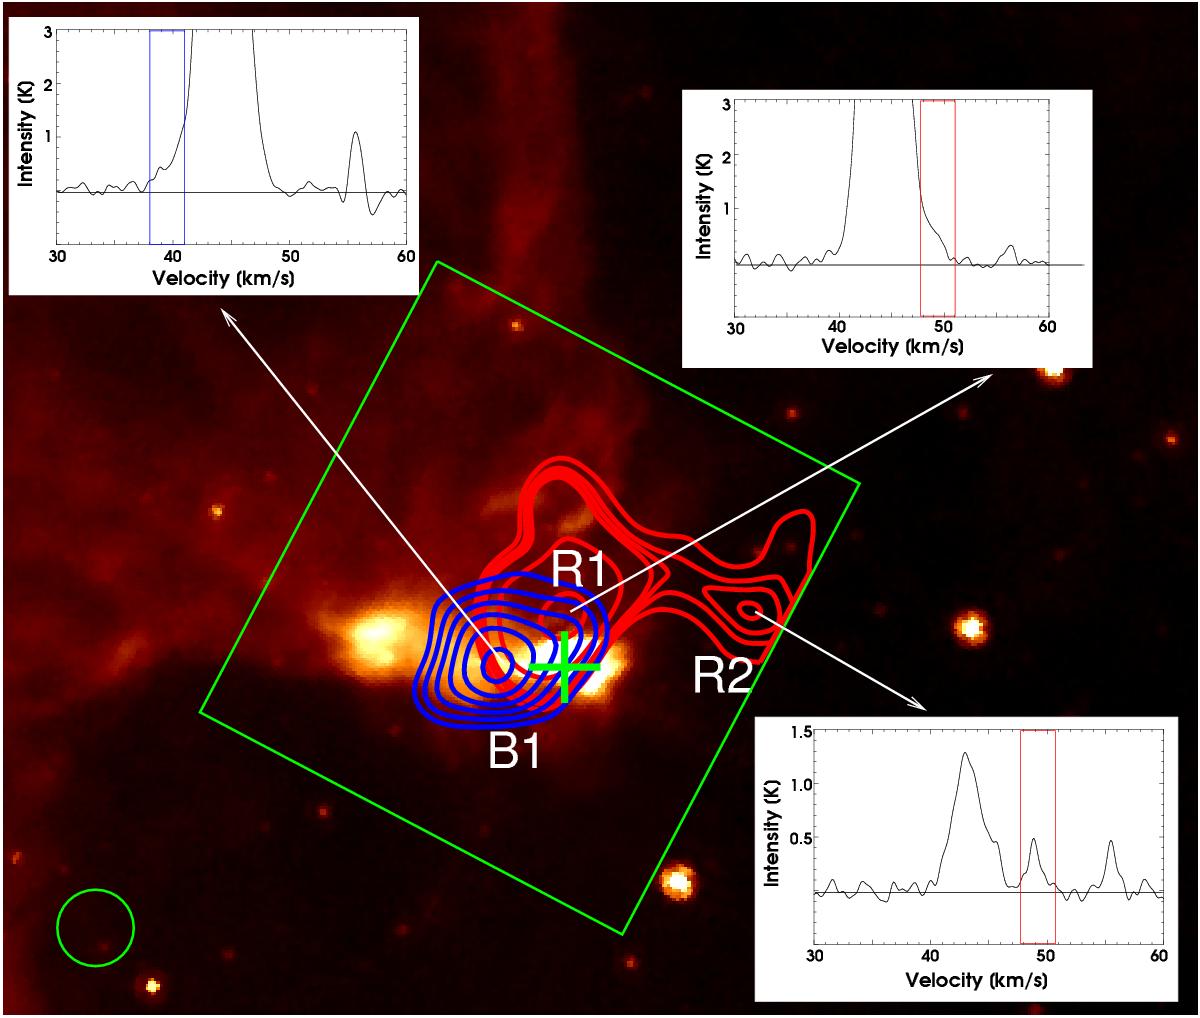
Spitzer-IRAC image at 8 μm of MSXG52. The blue and red contours represent the 12CO J = 3−2 emission averaged from 36 to 42 km s-1 (blue lobe), and from 48 to 51 km s-1 (red lobe), respectively. The blue contours are at 0.10, 0.12, 0.14, 0.16, and 0.18 K and the red ones are at 0.10, 0.12, 0.13, 0.14, 0.20, 0.30 K. We show the spectra toward the center of features B1, R1, and R2. The green cross indicates the location of MSXG52. The green box shows the area mapped with ASTE at this transition. The green circle represents the beam of the molecular observations.
Current usage metrics show cumulative count of Article Views (full-text article views including HTML views, PDF and ePub downloads, according to the available data) and Abstracts Views on Vision4Press platform.
Data correspond to usage on the plateform after 2015. The current usage metrics is available 48-96 hours after online publication and is updated daily on week days.
Initial download of the metrics may take a while.