Fig. 2
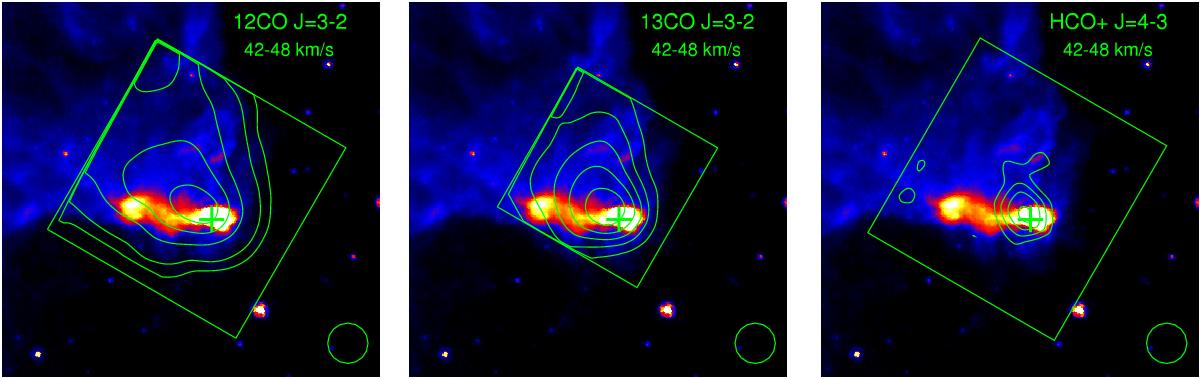
Averaged velocity maps of 12CO J = 3−2, 13CO J = 3−2, and HCO+J = 4−3 emissions between 42 and 48 km s-1. The boxes represent the region mapped with the ASTE telescope. The cross indicates the position of the MSXG52. Contours levels are at 1, 2, 3, 5, and 7 K for 12CO J = 3−2, at 1, 1.5, 2, 2.5, 3, 3.5 K for 13CO J = 3−2, and at 0.4, 0.6, 0.9, and 1.2 K for HCO+J = 4−3. Color scale runs from 20 to 150 MJy beam-1.
Current usage metrics show cumulative count of Article Views (full-text article views including HTML views, PDF and ePub downloads, according to the available data) and Abstracts Views on Vision4Press platform.
Data correspond to usage on the plateform after 2015. The current usage metrics is available 48-96 hours after online publication and is updated daily on week days.
Initial download of the metrics may take a while.