Fig. 9
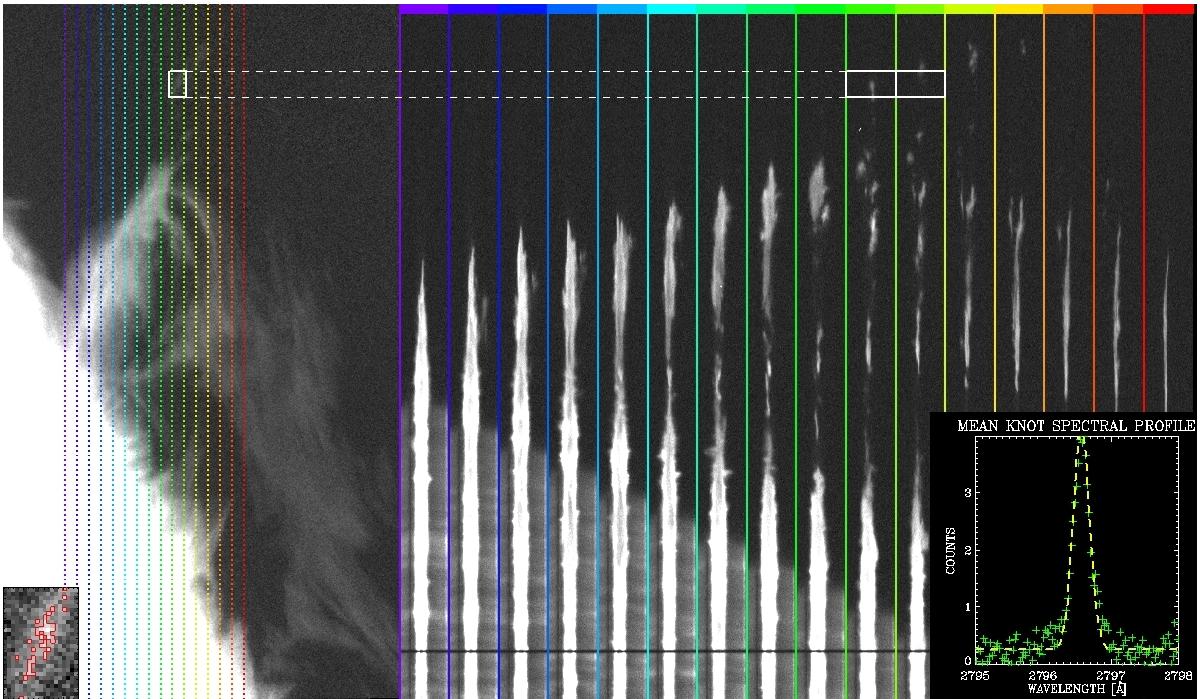
Slit-jaw image and corresponding spectra taken during one scan between 10:15:10 and 10:16:29 UT (animated image is online, see Movie 2). Dotted vertical lines indicate slit position in the FOV. Corresponding spectra are colour coded. White rectangle on the slit-jaw image shows knot area, which is magnified in the bottom-left corner. Red lines show 99% isophote. White rectangle on the spectra (top-right) indicates area of the spectrum which is taken for further analysis.
Current usage metrics show cumulative count of Article Views (full-text article views including HTML views, PDF and ePub downloads, according to the available data) and Abstracts Views on Vision4Press platform.
Data correspond to usage on the plateform after 2015. The current usage metrics is available 48-96 hours after online publication and is updated daily on week days.
Initial download of the metrics may take a while.