Fig. 5
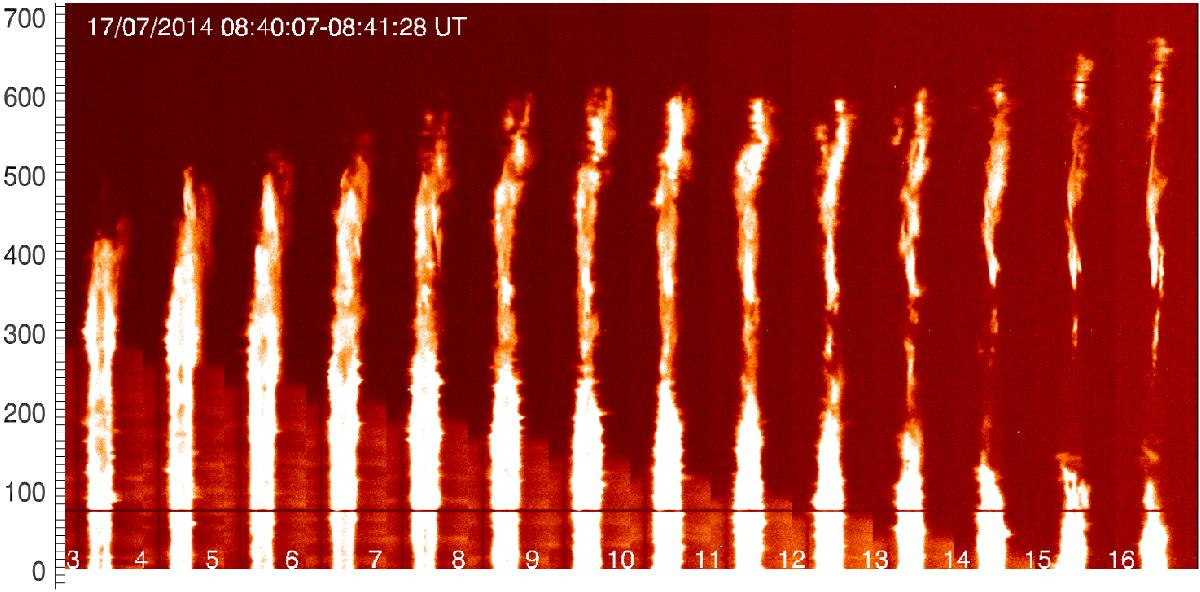
IRIS Mg ii k spectra during the first scan between 08:40:07 and 08:41:28 UT. Only the spectra crossing the prominence are shown (3 to 16). The left column represents the number of the pixels along the slit with a unit equal to the pixel size (0.167′′). The number of each position of the slit is indicated in the spectra at the bottom of the image.
Current usage metrics show cumulative count of Article Views (full-text article views including HTML views, PDF and ePub downloads, according to the available data) and Abstracts Views on Vision4Press platform.
Data correspond to usage on the plateform after 2015. The current usage metrics is available 48-96 hours after online publication and is updated daily on week days.
Initial download of the metrics may take a while.