Free Access
Fig. 2

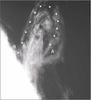
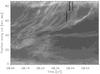
Left panel: prominence observed by SOT using the Ca ii K filter at 08:10 UT on July 17. Crosses follow an elliptical loop from right (A) to left (B). Right panel: time-distance diagram for the path along the loop joining A and B. The black vertical lines in the diagram are missing data.
This figure is made of several images, please see below:
Current usage metrics show cumulative count of Article Views (full-text article views including HTML views, PDF and ePub downloads, according to the available data) and Abstracts Views on Vision4Press platform.
Data correspond to usage on the plateform after 2015. The current usage metrics is available 48-96 hours after online publication and is updated daily on week days.
Initial download of the metrics may take a while.