Free Access
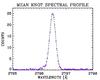
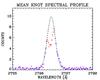
Fig. 11

Left panel: observed spectral profile (blue points) of an analysed knot with regular Gaussian shape. Right panel: spectral profile of an analysed knot with central reversal (red points). Gaussian fitting is performed on blue points only. Black dashed lines show fitted Gaussian profile.
This figure is made of several images, please see below:
Current usage metrics show cumulative count of Article Views (full-text article views including HTML views, PDF and ePub downloads, according to the available data) and Abstracts Views on Vision4Press platform.
Data correspond to usage on the plateform after 2015. The current usage metrics is available 48-96 hours after online publication and is updated daily on week days.
Initial download of the metrics may take a while.