Fig. A.1
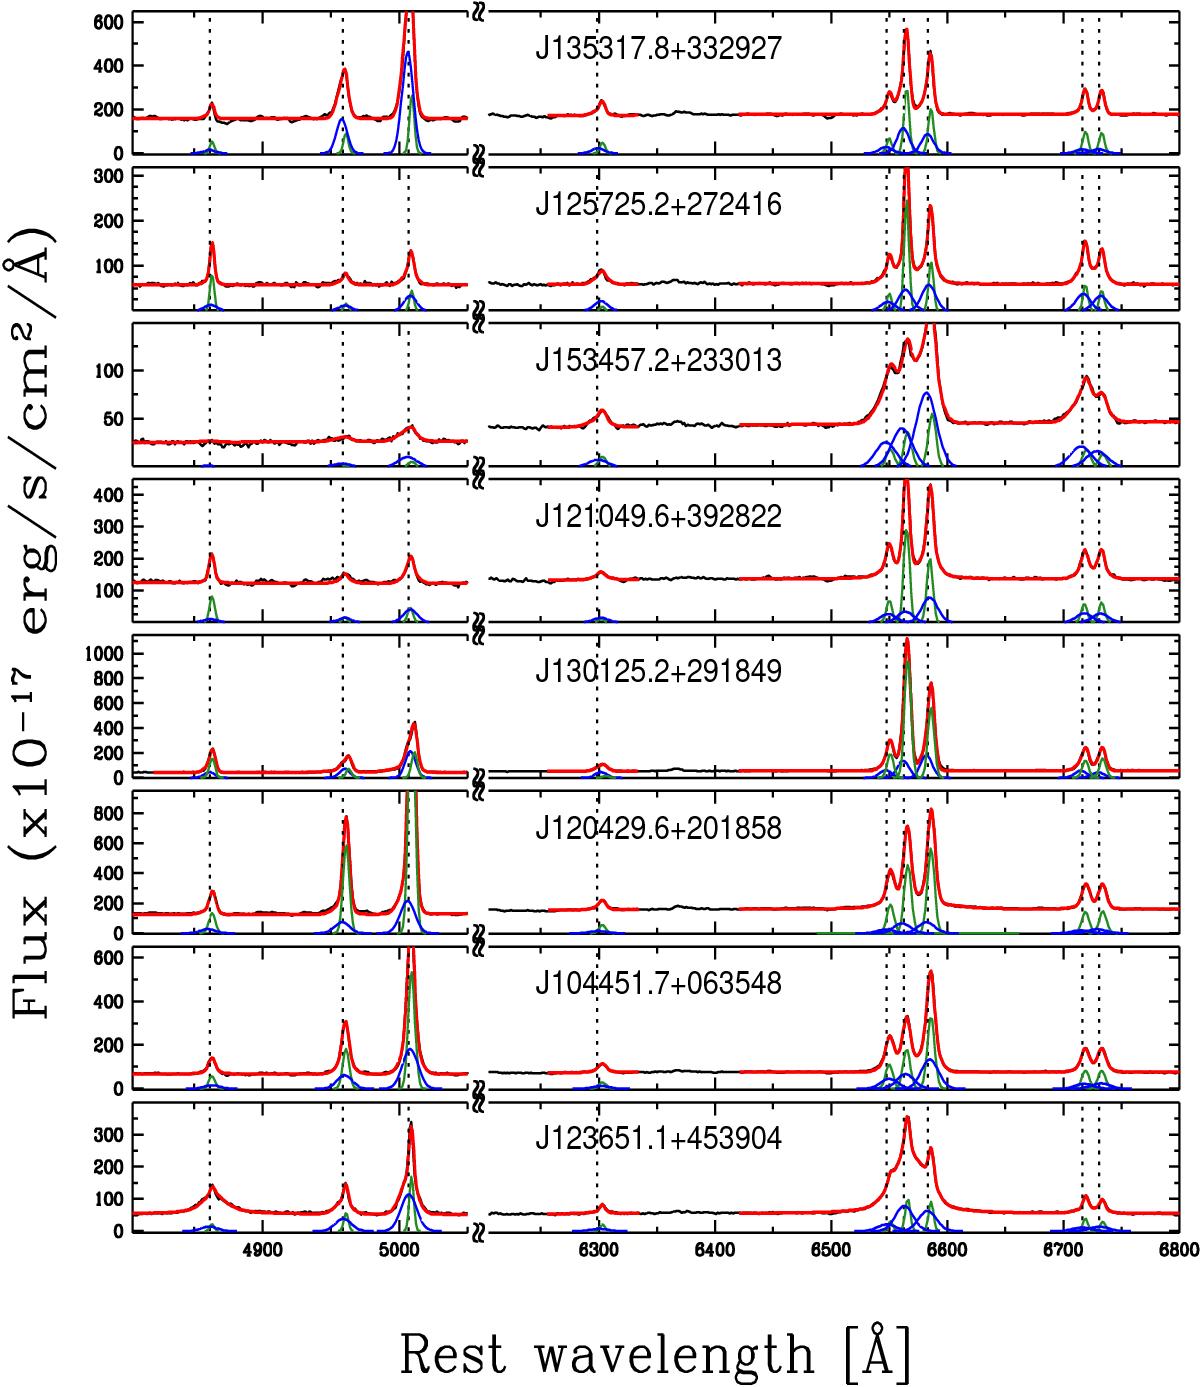
Rest-frame optical spectra of 8 out 28 AGNs for which we derive density-sensitive flux ratios. For each object, we show the spectrum (black curve) and the best-fit models (red curves) obtained from multicomponent simultaneous fit in the regions around the Hβ and the Hα emission. The dashed vertical lines mark the location of Hβ, [O III] doublet, [O I], Hα, [N II] and [S II] doublets. Best-fit NC and BC profiles are shown with green curves; blue curves show OC emission.
Current usage metrics show cumulative count of Article Views (full-text article views including HTML views, PDF and ePub downloads, according to the available data) and Abstracts Views on Vision4Press platform.
Data correspond to usage on the plateform after 2015. The current usage metrics is available 48-96 hours after online publication and is updated daily on week days.
Initial download of the metrics may take a while.