Fig. 6
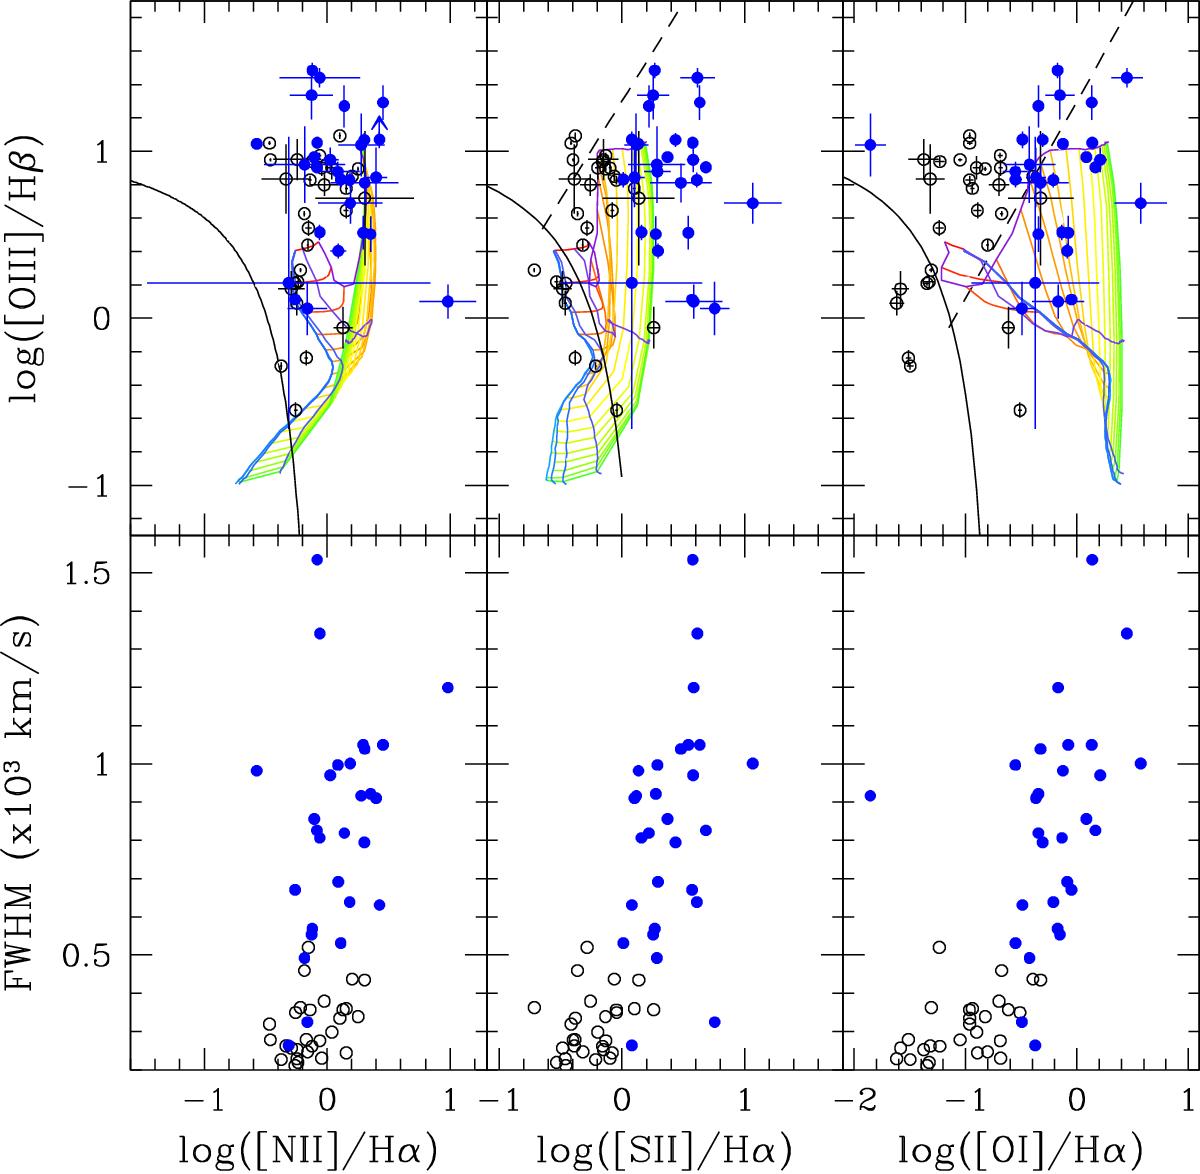
Top panels: [O III]/Hβ versus [N II]/Hα, [S II]/Hα and [O I]/Hα BPT diagrams for the 28 sources used to derive the outflow electron density. Solid and dashed black lines represent the curve used to separate the purely SF galaxies, AGNs and LINER loci. Shock model grids are overplotted, with increasing velocities, from 100 to 1000 km s-1 (red to green lines), and magnetic field (blue to purple curves). Bottom panels: FWHM plotted against log([N II]/Hα), log([S II]/Hα), and [O I]/Hαfrom left to right. Both NC (open black) and OC (solid blue symbols) are shown. Positive correlations are found between the three ionisation state and the gas kinematics tracers.
Current usage metrics show cumulative count of Article Views (full-text article views including HTML views, PDF and ePub downloads, according to the available data) and Abstracts Views on Vision4Press platform.
Data correspond to usage on the plateform after 2015. The current usage metrics is available 48-96 hours after online publication and is updated daily on week days.
Initial download of the metrics may take a while.