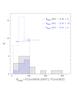
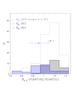
Fig. 4

left: [O III] ratio distributions. Grey shaded areas mark the R[OIII] distribution for the unperturbed ionised gas (i.e. NC). Blue shaded area denotes the outflow emission R[OIII] distribution of S/N> 10 sources. The blue dashed line shows the R[OIII] histogram of the outflow components of all S/N> 5 sources (see the text for detailed analysis description). In each panel, median and 68% confidence intervals obtained from the analysis of stacked spectra are also shown for comparison (black and blue symbols, representing line ratios associated with NC and OC, respectively). Right: [S II]λλ6716, 6731 ratio distributions. The grey solid line marks the distribution for the AGN sample without evidence of outflows from our line fitting routine. The black and blue shaded areas denote the distributions for NC and OC sulphur ratios obtained from the sub-sample of 28 AGNs.
Current usage metrics show cumulative count of Article Views (full-text article views including HTML views, PDF and ePub downloads, according to the available data) and Abstracts Views on Vision4Press platform.
Data correspond to usage on the plateform after 2015. The current usage metrics is available 48-96 hours after online publication and is updated daily on week days.
Initial download of the metrics may take a while.