Free Access
Fig. 3
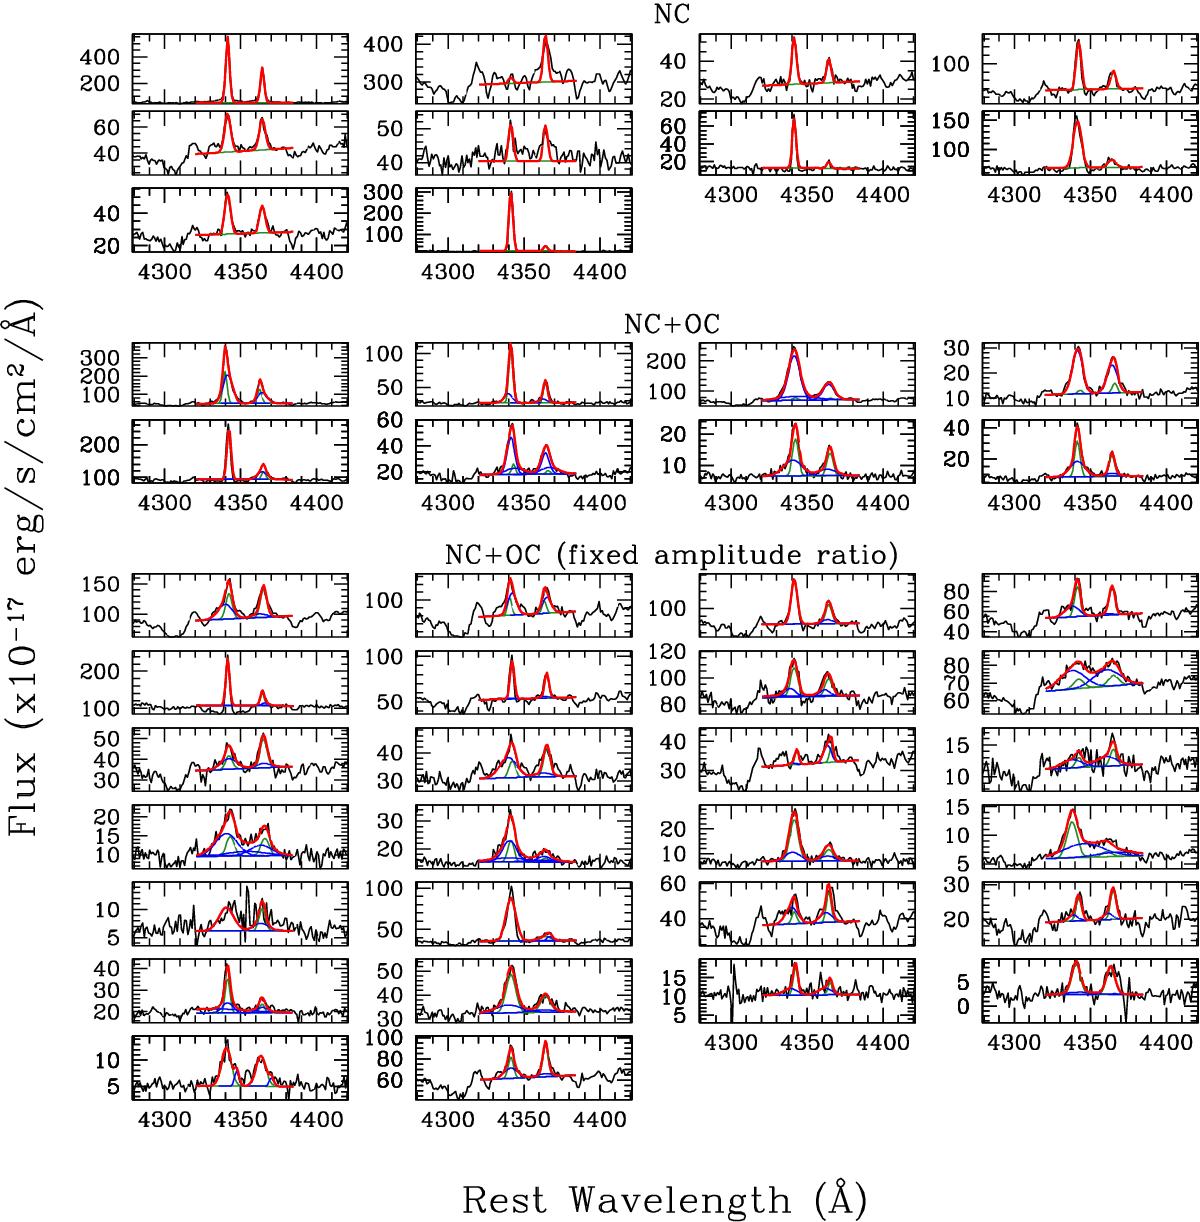
Magnification of the region of [O III]λ4363-Hγλ4342 lines for the 44 sources for which we could determine R[OIII] flux ratios. For each spectrum, the best-fitting components presented in Sect. 3.1 are superimposed: solid green curves represent the systemic narrow component (NC); blue curves the OC.
Current usage metrics show cumulative count of Article Views (full-text article views including HTML views, PDF and ePub downloads, according to the available data) and Abstracts Views on Vision4Press platform.
Data correspond to usage on the plateform after 2015. The current usage metrics is available 48-96 hours after online publication and is updated daily on week days.
Initial download of the metrics may take a while.