Fig. 2
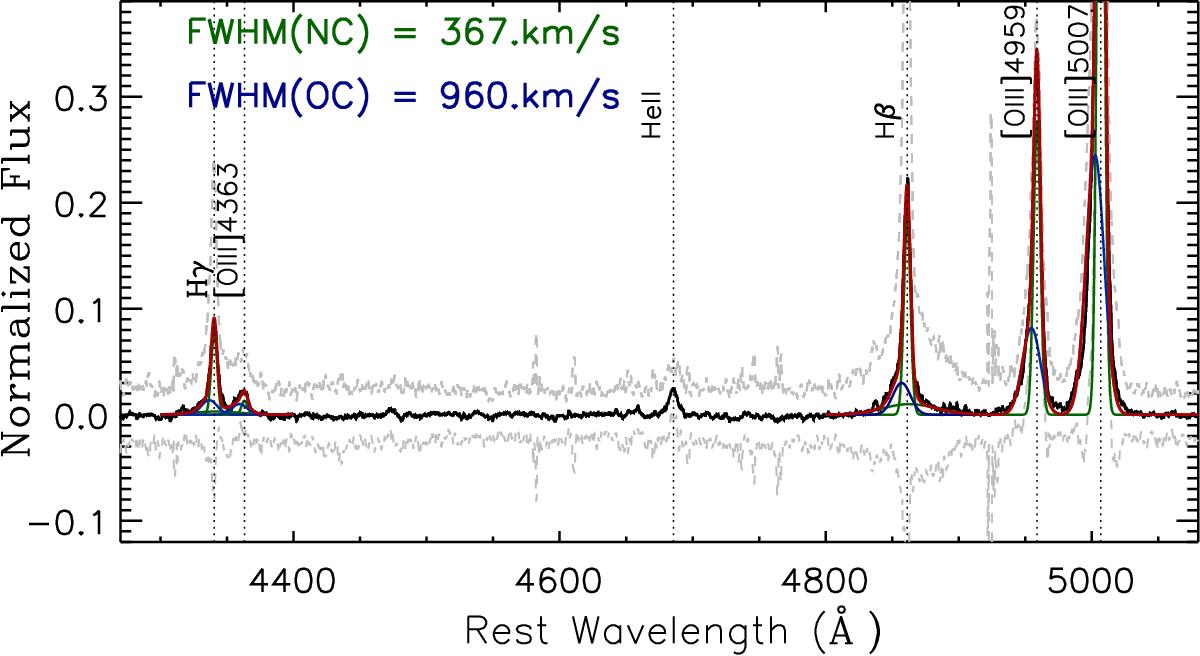
Median stacked spectrum around the doubly ionised oxygen emission lines obtained combining the spectra of faint/obscured sources with evidence of ionised outflows (see the text for more details). Dashed curves highlight 1σ uncertainties. Red curve represents the best-fit result we obtained fitting simultaneously the emission lines displayed. Green Gaussian represent NC and BC components, blue profiles mark OC.
Current usage metrics show cumulative count of Article Views (full-text article views including HTML views, PDF and ePub downloads, according to the available data) and Abstracts Views on Vision4Press platform.
Data correspond to usage on the plateform after 2015. The current usage metrics is available 48-96 hours after online publication and is updated daily on week days.
Initial download of the metrics may take a while.