Fig. 1
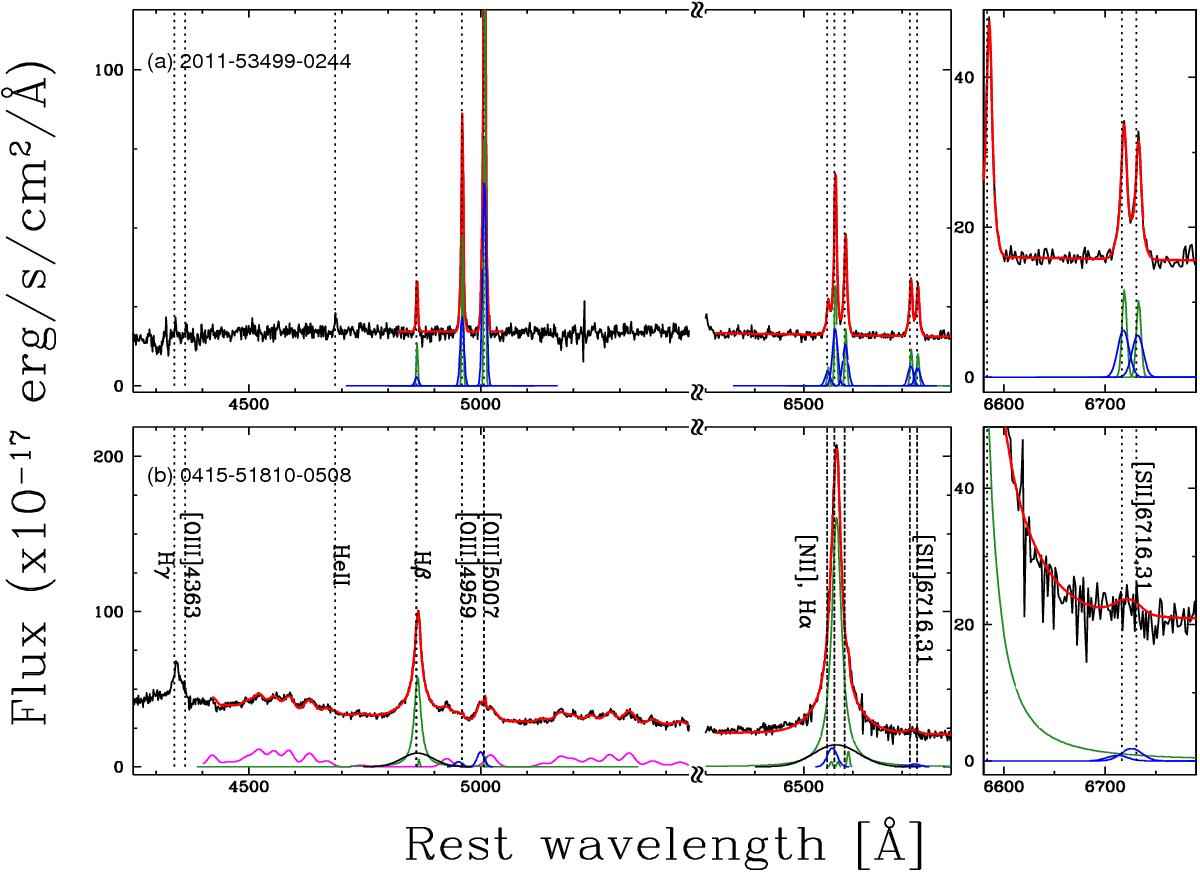
Rest-frame optical spectra of two AGNs from our X-ray/SDSS sample. For each target, in the upper left corner of the large panel we show the MJD, the plate and the fibre numbers which uniquely identify the SDSS spectrum. The dashed vertical lines mark the location of the most prominent emission lines, besides some features crucial for the analysis presented in this paper and/or in Paper I. Fit results obtained in Paper I, from the multicomponent simultaneous fit in the Hβ-[O III] and Hα-[NII] regions are also shown: best-fit narrow component (NC) and broad line region component (BC) profiles are highlighted with green curves; outflow component (OC) and Fe II emission are shown with blue and magenta curves, respectively. Finally, black Gaussian profile in the low panel shows a second set of BC used to fit the complex BLR profiles (see Paper I for further details). The insets on the right of each panel show an enlargement of the sulphur lines. The spectra display faintness and blending problems affecting density-sensitive [S II]λλ6716, 6731 and temperature-sensitive [O III]λ4363 emission lines. In particular, the object in the first panel displays a well detected and modelled sulphur doublet, from which we can easily derive the density-sensitive flux ratio, but faint oxygen λ4363 line; the spectrum in the lower panel shows blended sulphur doublet features and oxygen line at λ4363. For both the AGNs it is therefore not possible to derive temperature-sensitive flux ratios.
Current usage metrics show cumulative count of Article Views (full-text article views including HTML views, PDF and ePub downloads, according to the available data) and Abstracts Views on Vision4Press platform.
Data correspond to usage on the plateform after 2015. The current usage metrics is available 48-96 hours after online publication and is updated daily on week days.
Initial download of the metrics may take a while.