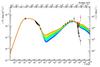
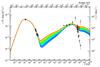
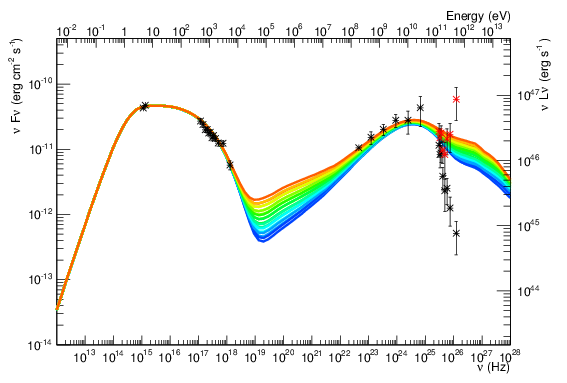
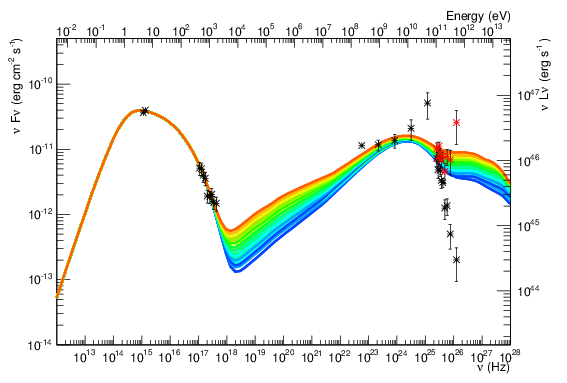
Fig. 6

Modeling of PKS 1424+240 in a hadronic scenario, for the 2009 (left) and 2013 (right) campaigns, for a value of the Doppler factor δ = 30. Only the overall emission is plotted. The colors, from blue to red, represent a decrease in the size of the emitting region R, and an increase in the strength of the magnetic field B. The model parameters are provided in Table 3. The VERITAS data (Archambault et al. 2014) deabsorbed using the EBL model by Franceschini et al. (2008) are plotted in red.
Current usage metrics show cumulative count of Article Views (full-text article views including HTML views, PDF and ePub downloads, according to the available data) and Abstracts Views on Vision4Press platform.
Data correspond to usage on the plateform after 2015. The current usage metrics is available 48-96 hours after online publication and is updated daily on week days.
Initial download of the metrics may take a while.