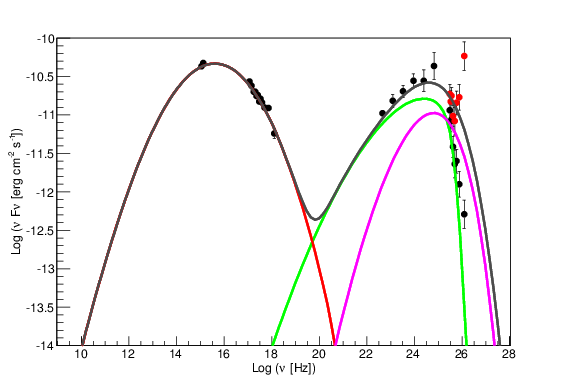
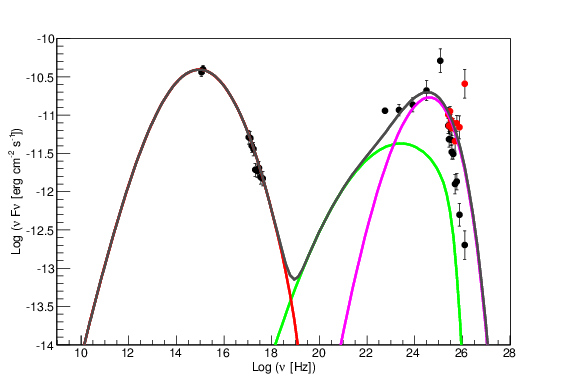
Fig. 5
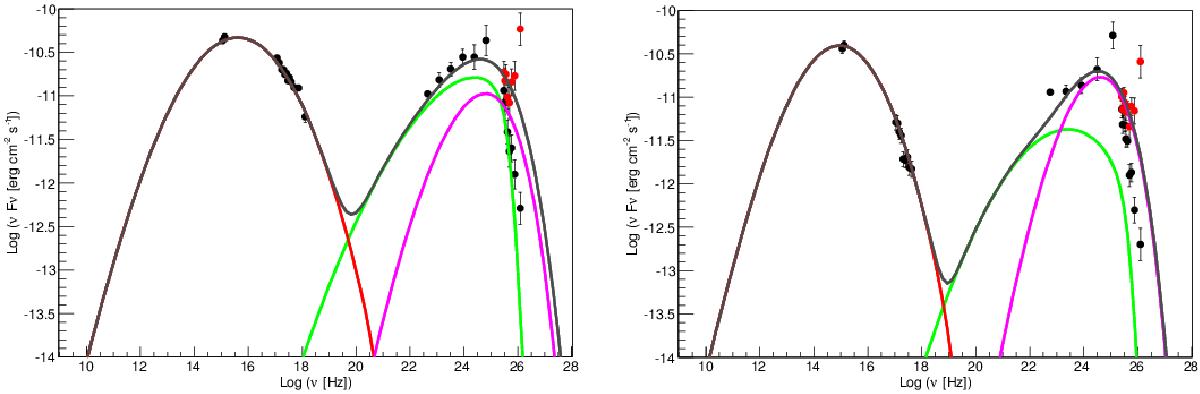
Modeling of PKS 1424+240 in an EIC scenario, for the 2009 (left) and 2013 (right) campaigns. The black solid line represents the total emission; the red line represents the synchrotron emission by leptons; the green line the SSC component; the pink line the EIC component assuming that the external photon field is produced by the dusty torus. The model parameters are provided in Table 2. The models do not include absorption over the EBL. The VERITAS data (Archambault et al. 2014) deabsorbed using the EBL model by Franceschini et al. (2008) are plotted in red.
Current usage metrics show cumulative count of Article Views (full-text article views including HTML views, PDF and ePub downloads, according to the available data) and Abstracts Views on Vision4Press platform.
Data correspond to usage on the plateform after 2015. The current usage metrics is available 48-96 hours after online publication and is updated daily on week days.
Initial download of the metrics may take a while.