Fig. 3
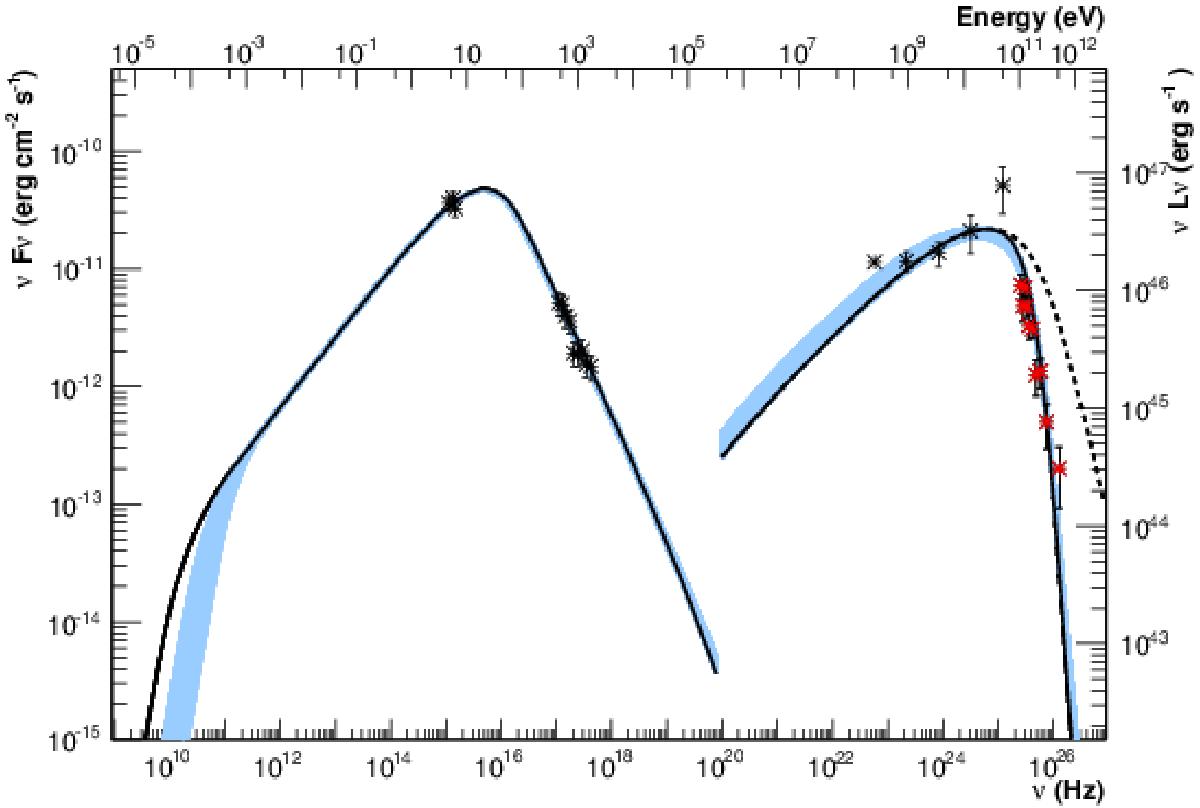
One-zone SSC modeling of PKS 1424+240. The blue band represents all of the SSC models corresponding to the parameters given in Table 1. The black model represents the SSC solution provided by Kang et al. (2016). The black dashed line in the VHE regime represents the solution provided by Kang et al. (2016) computed at the source, before absorption on the EBL.
Current usage metrics show cumulative count of Article Views (full-text article views including HTML views, PDF and ePub downloads, according to the available data) and Abstracts Views on Vision4Press platform.
Data correspond to usage on the plateform after 2015. The current usage metrics is available 48-96 hours after online publication and is updated daily on week days.
Initial download of the metrics may take a while.