Fig. 2
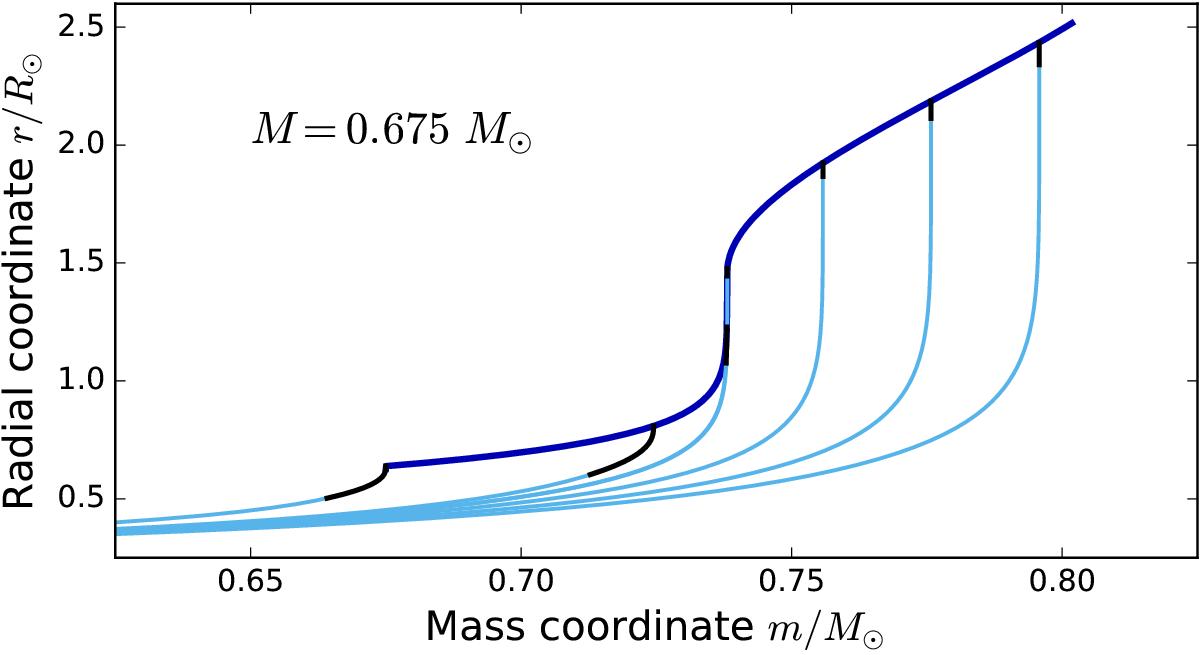
Evolution of the mass distribution in a uniformly rotating model with an initial mass of 0.675 M⊙ when adding matter with ja = 2 × 1017 cm2s-1 at a rate of Ṁ = 10-6M⊙ yr-1. The light-blue lines show the radius variation with mass in six models from just prior to mass addition to near critical rotation (ΔM ≃ 0.125 M⊙). The black sections of the profiles indicate convective regions. The upper (dark-blue) envelope shows the evolution of the surface radius during mass addition.
Current usage metrics show cumulative count of Article Views (full-text article views including HTML views, PDF and ePub downloads, according to the available data) and Abstracts Views on Vision4Press platform.
Data correspond to usage on the plateform after 2015. The current usage metrics is available 48-96 hours after online publication and is updated daily on week days.
Initial download of the metrics may take a while.