Free Access
Fig. 3
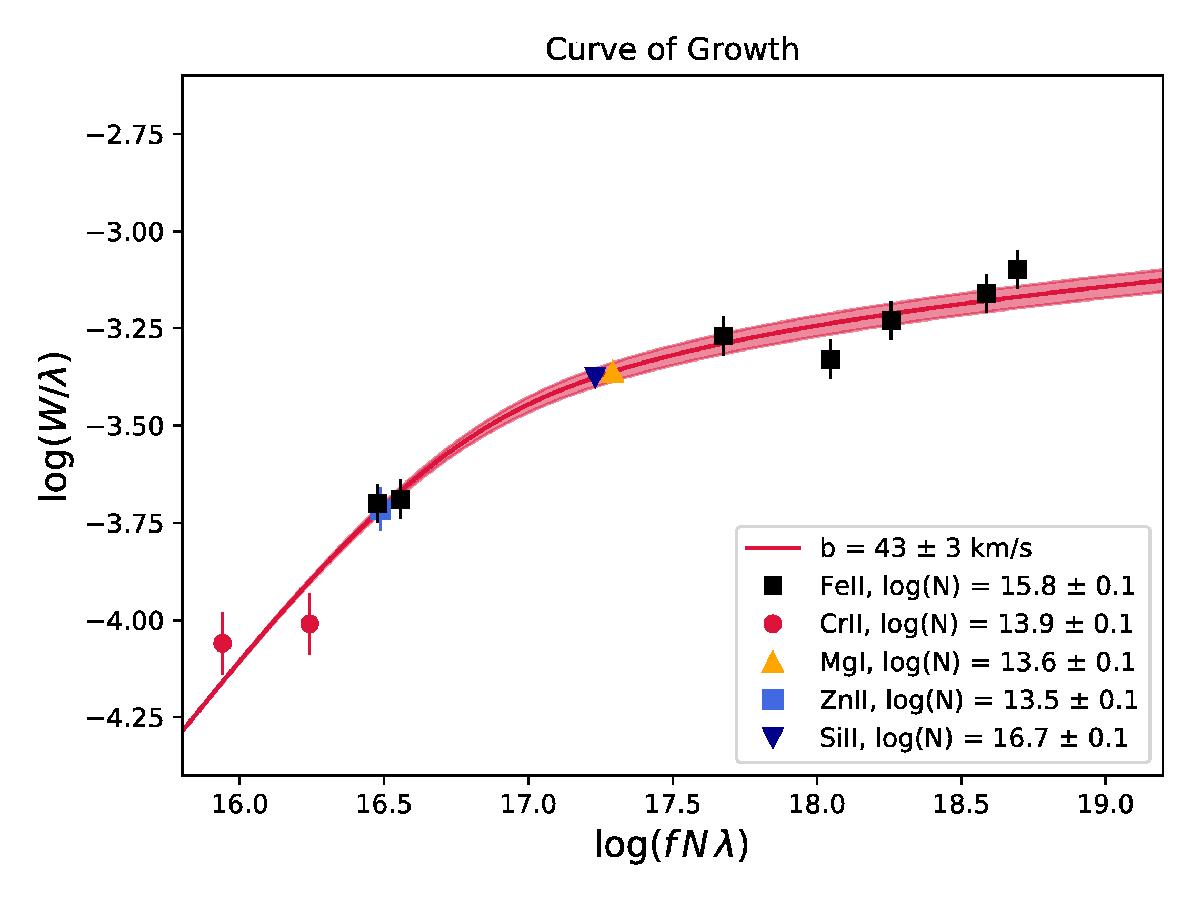
Curve of growth (COG) for Fe ii lines from the z = 2.027 DLA. The other species are assumed to follow the same COG and are plotted for comparison. The red shaded area indicates the 1σ uncertainty on the b parameter.
Current usage metrics show cumulative count of Article Views (full-text article views including HTML views, PDF and ePub downloads, according to the available data) and Abstracts Views on Vision4Press platform.
Data correspond to usage on the plateform after 2015. The current usage metrics is available 48-96 hours after online publication and is updated daily on week days.
Initial download of the metrics may take a while.