Fig. 3
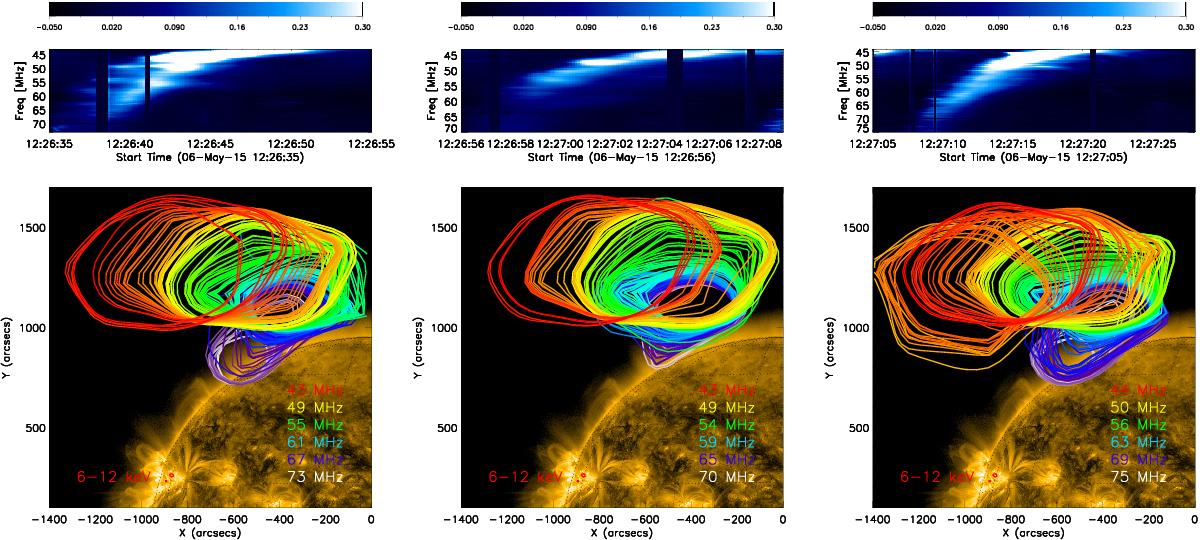
Dynamic spectra and images of the two J-bursts and the U-burst. Each burst is imaged at times corresponding to the peak flux in all frequencies taken from the fit using Eq. (1). The frequencies shown are the central frequency from each sub-band. The image background is AIA EUV at 171 Å. The small red contours in the bottom left are the RHESSI 6−12 keV contours that were imaged over the minute when the radio bursts were detected.
Current usage metrics show cumulative count of Article Views (full-text article views including HTML views, PDF and ePub downloads, according to the available data) and Abstracts Views on Vision4Press platform.
Data correspond to usage on the plateform after 2015. The current usage metrics is available 48-96 hours after online publication and is updated daily on week days.
Initial download of the metrics may take a while.