Fig. 4
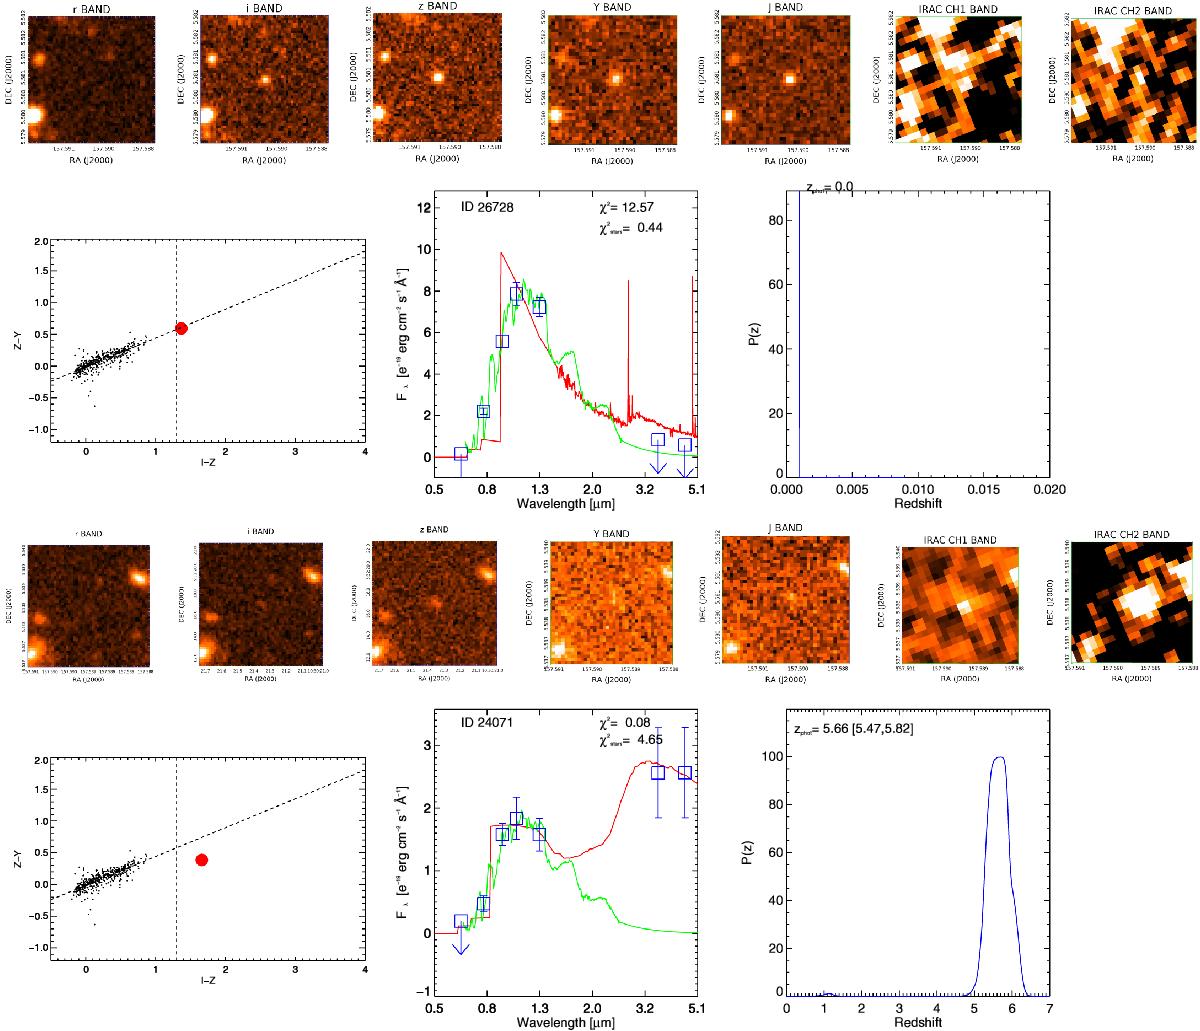
Example of our classification strategy based on morphology, colors, and photometric redshift for two z ~ 6 LBG candidates in the J1030 field, that we respectively classified as likely star (upper panel) and highz objects (lower panel). Upper panel (same for the lower panel): a) postage stamps (7′′ on a side) in the r, i, z, Y, J, IRAC/ch1, IRAC/ch2 filters. We note that the apparent mismatch of the point sources in the IRAC images is due to the lack of Spitzer data for some targets. b) Photometric colors diagnostic plot. The small black dots are stars in the field and the dashed line represents an extrapolation of the stellar locus based on the colors of known M, L, and T-type dwarfs. The red point represents the color of the LBG candidate. c) SED fitting and photometric redshift determination for the same candidate. Blue squares represent AB magnitudes in r, i, z, Y, J, and Spitzer/IRAC ch1 and ch2 bands with 1σ-error. The best fit is shown with a red line for galaxy and with a green line for stellar case solutions. We report the χ2 for the two template solutions. d) Corresponding probability distribution of the best fit as a function of redshift. We present these summary plots for all the candidates in Appendix A.
Current usage metrics show cumulative count of Article Views (full-text article views including HTML views, PDF and ePub downloads, according to the available data) and Abstracts Views on Vision4Press platform.
Data correspond to usage on the plateform after 2015. The current usage metrics is available 48-96 hours after online publication and is updated daily on week days.
Initial download of the metrics may take a while.