Fig. 3
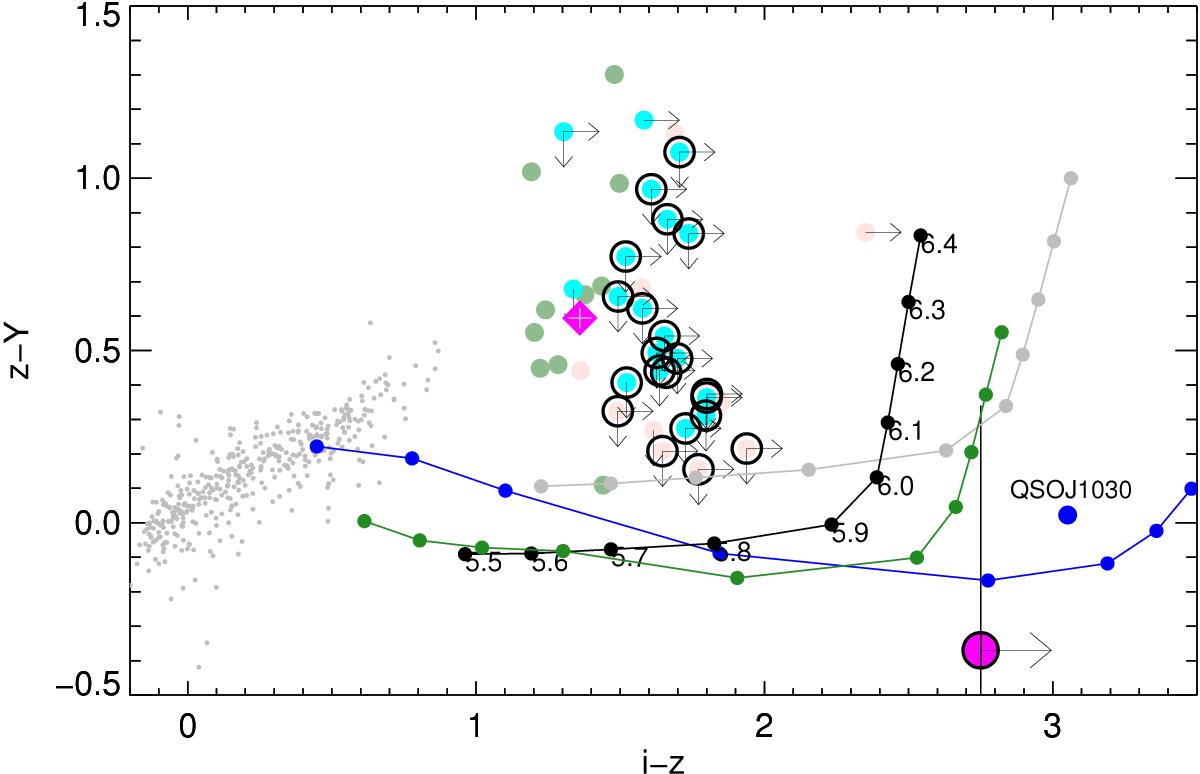
Diagnostic (z−Y) versus (i−z) color-color diagram. Small gray dots are point-like sources in the J1030 field (star locus). Red, green, and cyan are the primary and secondary candidates of M14 and the new faint candidates, respectively. For those objects that are not detected at the 2σ level in i or in Y, we used the 2σ local limiting magnitudes. The limits on their colors are marked with arrows. The black curve shows the expected color track (in steps of Δz = 0.1, starting from 5.5) of a high-z star-forming galaxy with age 0.5 Gyr and Z = 0.02 Z⊙ (from Bruzual & Charlot 2003). The gray curve has been calculated with the same template but with an intrinsic absorption Av equal to one and the green curve adding to the template a Lyα emission line with EW = 100 Å rest frame. The blue curve shows the expected color track of a Type 1 QSO (template from the SWIRE library). Objects that have now been classified as reliable z ~ 6 LBGs (see Table 3 and Sect. 4) are marked with large black open circles. The bigger magenta circle and the diamond symbol represent the colors of the stack of the LBG candidates and stellar contaminants, respectively. The blue point marks the position of the central QSO SDSS J1030+0524 at z = 6.31.
Current usage metrics show cumulative count of Article Views (full-text article views including HTML views, PDF and ePub downloads, according to the available data) and Abstracts Views on Vision4Press platform.
Data correspond to usage on the plateform after 2015. The current usage metrics is available 48-96 hours after online publication and is updated daily on week days.
Initial download of the metrics may take a while.