Fig. 9
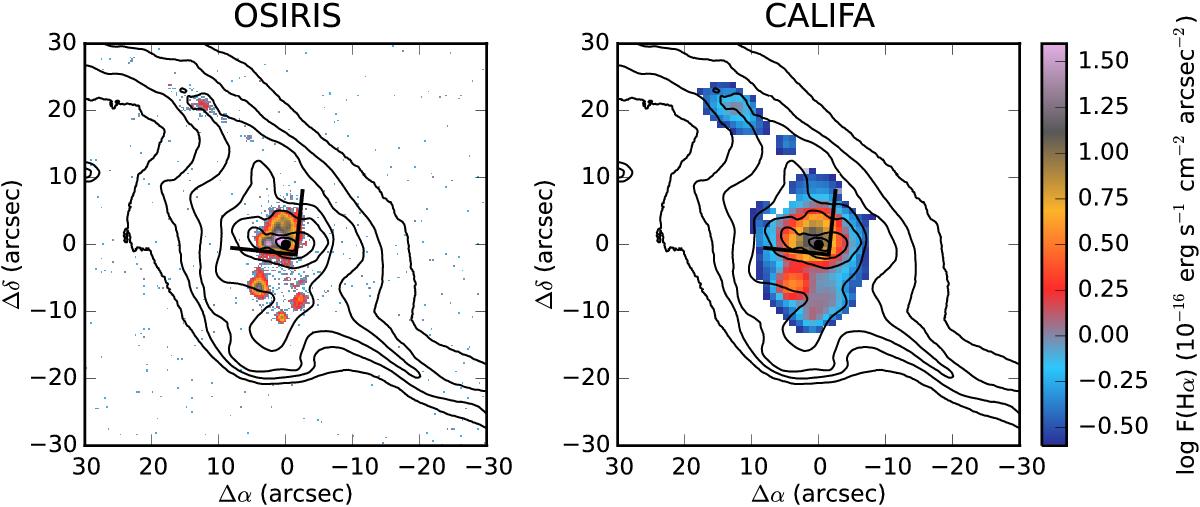
OSIRIS Hα (left) and CALIFA Hα (right) emission line fluxes in units of 10-16 erg s-1 cm-2 arcsec-2 presented on a logarithmic scale. The black cone delimits the nuclear outflowing nebula reported by Lípari et al. (2004). The HST F555W image is shown in contours, smoothed to approximately match the spatial resolution of our IFS data.
Current usage metrics show cumulative count of Article Views (full-text article views including HTML views, PDF and ePub downloads, according to the available data) and Abstracts Views on Vision4Press platform.
Data correspond to usage on the plateform after 2015. The current usage metrics is available 48-96 hours after online publication and is updated daily on week days.
Initial download of the metrics may take a while.