Fig. 4
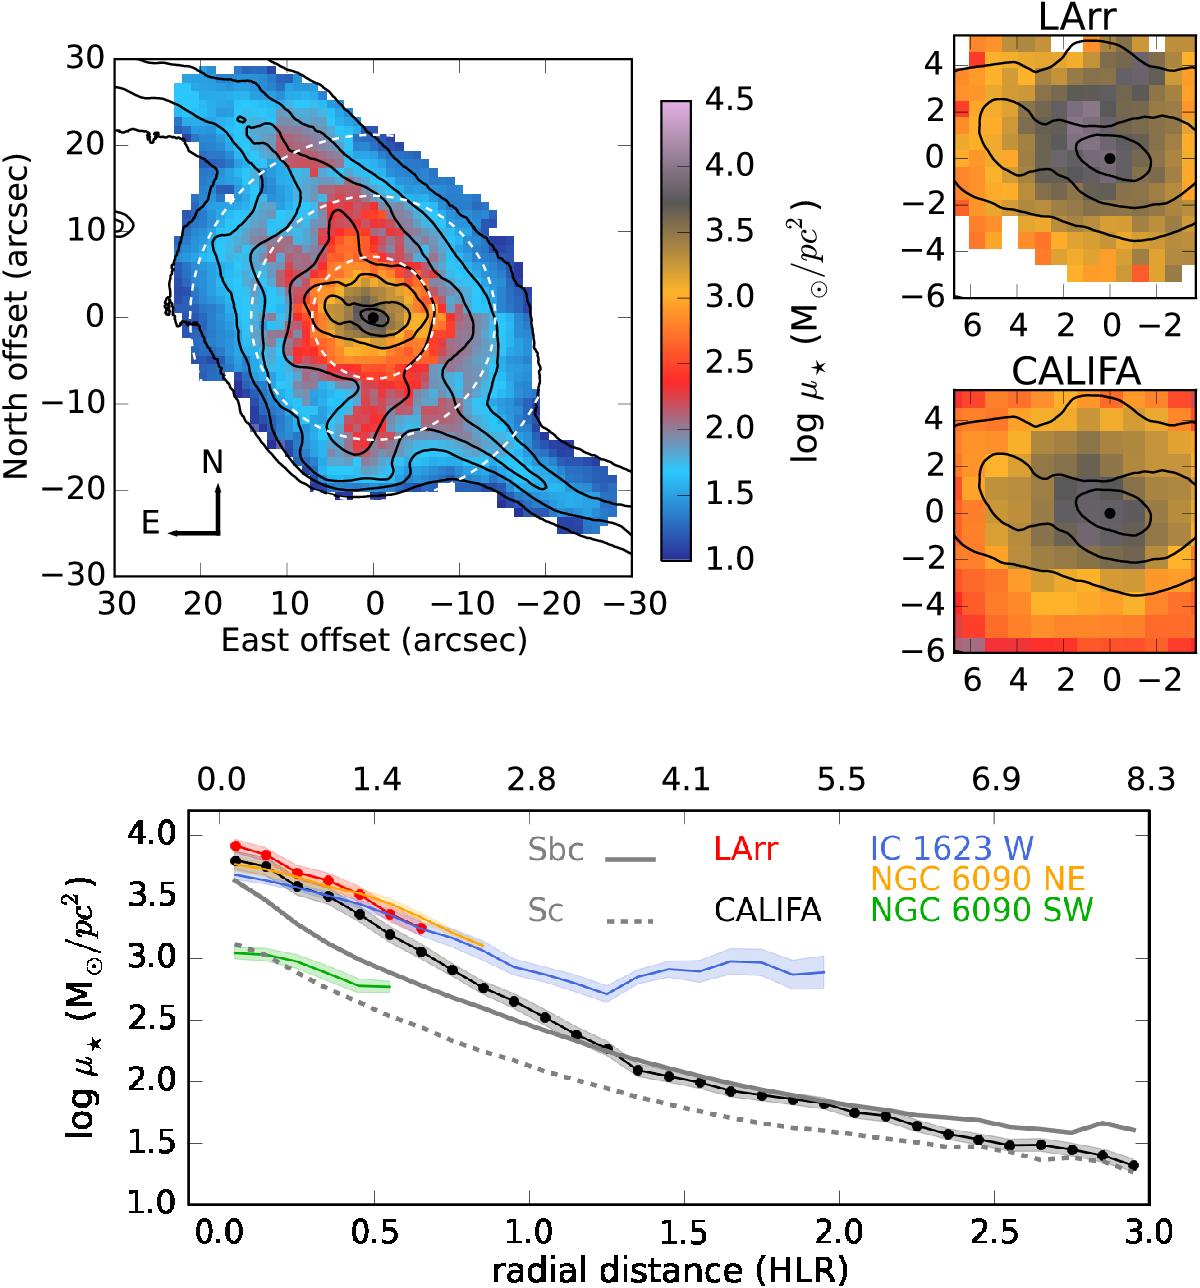
Upper left: CALIFA map of the stellar mass surface density (μ⋆). The white dashed lines indicate the position of 1, 2, and 3 half-light radii (HLR); 1 HLR is equivalent to 2.8 kpc in physical distance. The contours correspond to the smoothed HST F555W image. Upper right: LArr map of stellar mass surface density. The color-scale is the same as for the CALIFA map. Below is presented a zoom of the CALIFA map in the nuclear region, to match the region covered by LArr map. Lower panel: radial profile of log μ⋆ as a function of the radial distance in HLR (lower horizontal axis) and kpc (upper horizontal axis), in red for LArr and black for CALIFA. The uncertainties, calculated as the standard error of the mean, are shaded in light red and gray, respectively. For comparison, the gray lines are the profiles from Sbc (solid) and Sc (dashed) spiral galaxies from CALIFA (González Delgado et al. 2015), with stellar masses similar to that of NGC 2623. We also include the profiles of the early-stage mergers IC 1623 W (blue), NGC 6090 NE (orange), and NGC 6090 SW (green).
Current usage metrics show cumulative count of Article Views (full-text article views including HTML views, PDF and ePub downloads, according to the available data) and Abstracts Views on Vision4Press platform.
Data correspond to usage on the plateform after 2015. The current usage metrics is available 48-96 hours after online publication and is updated daily on week days.
Initial download of the metrics may take a while.