Fig. C.1
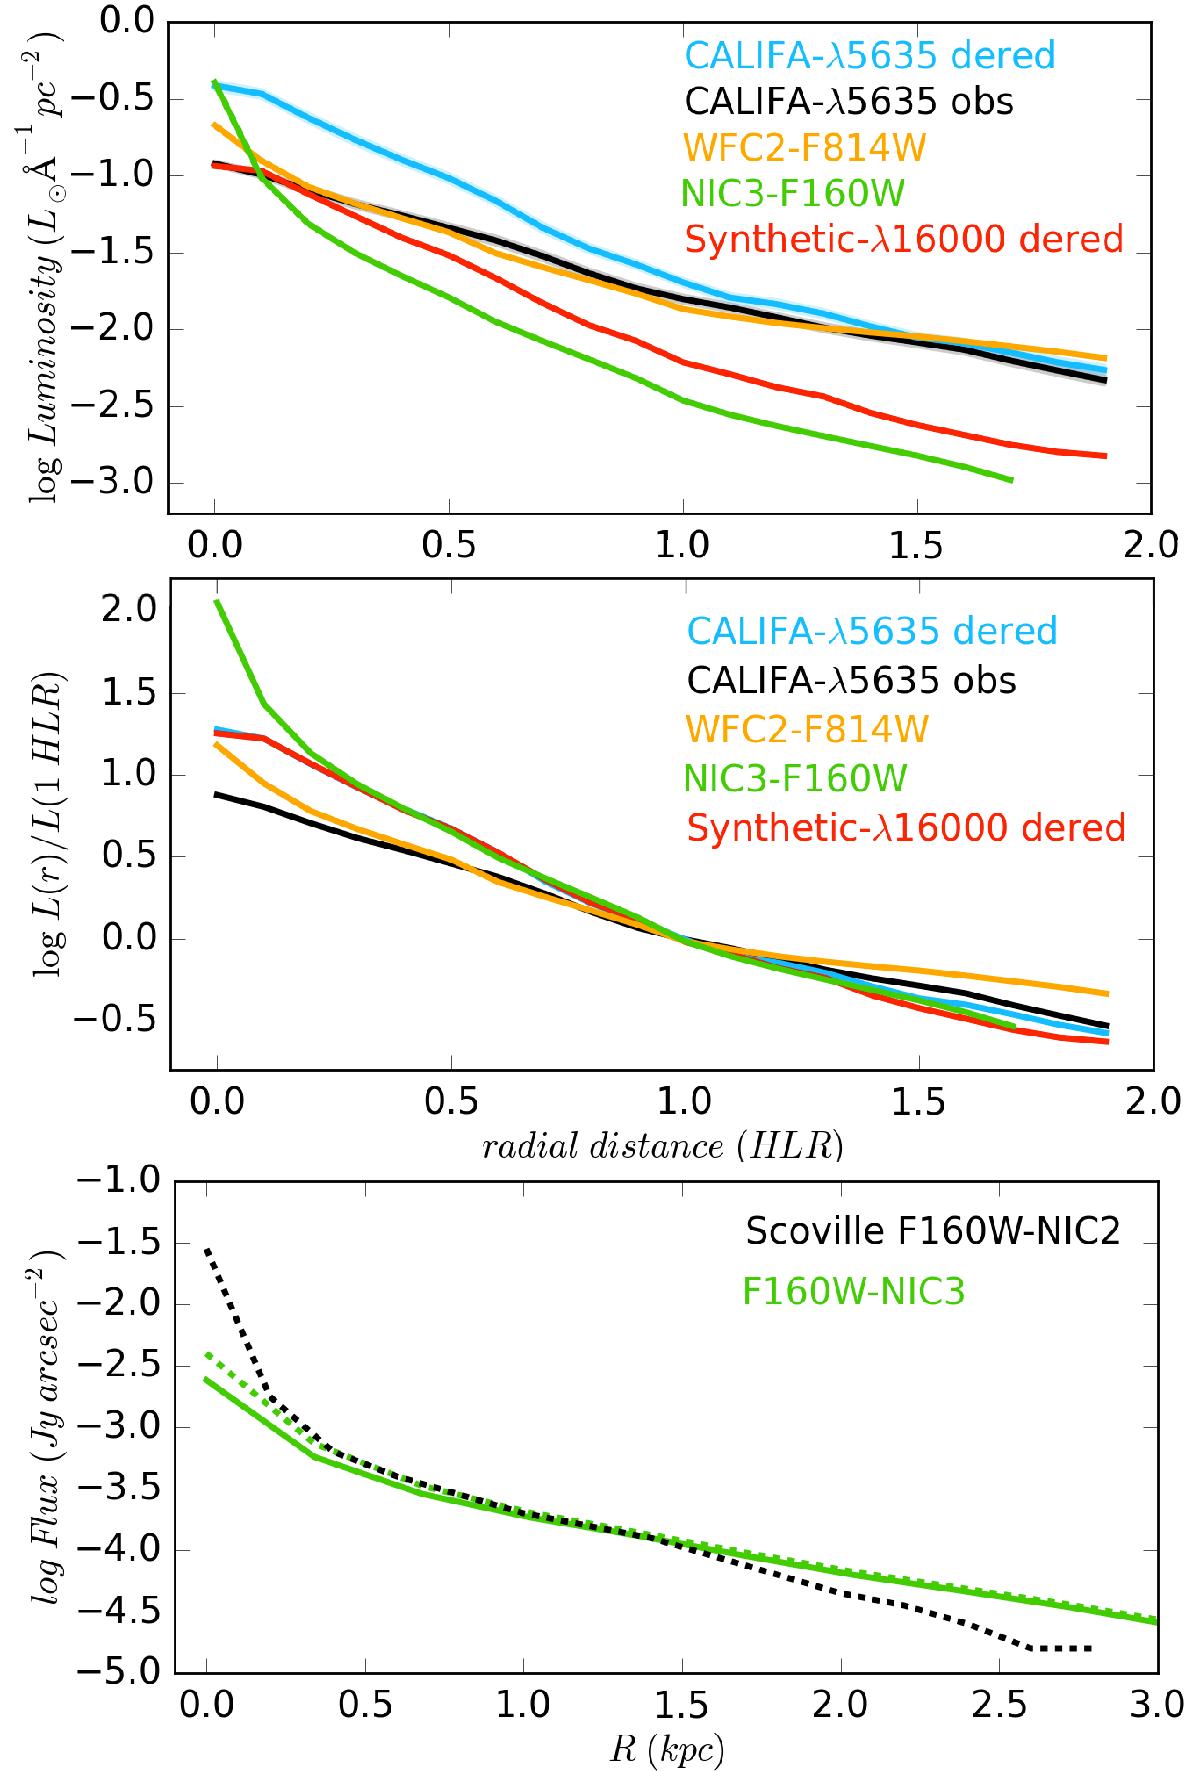
Top panel: comparison of the different surface brightness profiles. Middle panel: same profiles normalized at 1 HLR to compare the slopes. Bottom panel: comparison of the observed (solid green line) and dereddened (dashed green line) NIC3 F160W brightness profile, with NIC2 F160W profile reported in the literature by Scoville et al. (2000).
Current usage metrics show cumulative count of Article Views (full-text article views including HTML views, PDF and ePub downloads, according to the available data) and Abstracts Views on Vision4Press platform.
Data correspond to usage on the plateform after 2015. The current usage metrics is available 48-96 hours after online publication and is updated daily on week days.
Initial download of the metrics may take a while.