Fig. 2
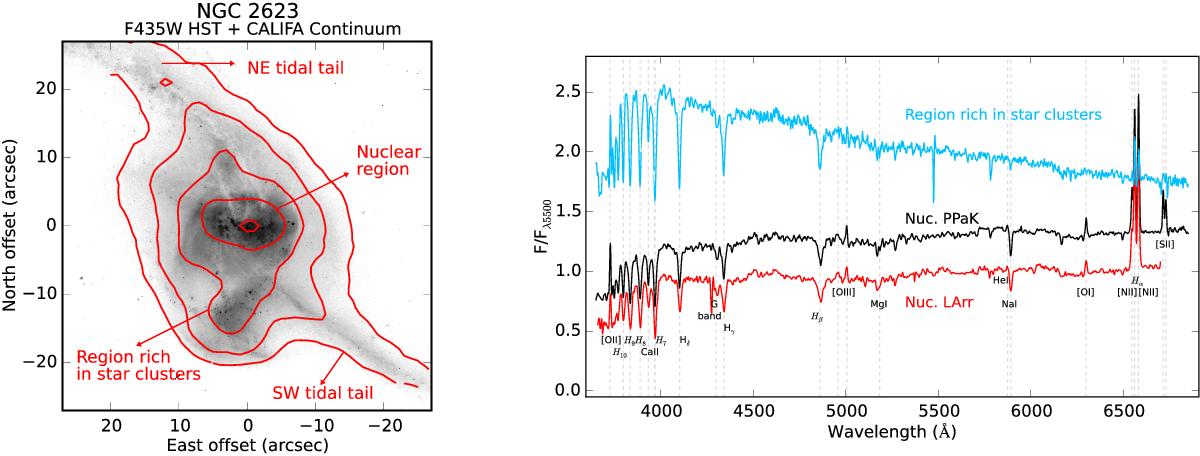
Left panel: HST F435W continuum image of NGC 2623, with the average continuum from CALIFA IFS superimposed using red contours. Several regions of the galaxy are labelled. Right panel: spectra from different regions extracted in circular apertures of 2′′ radius, in black the PPaK nuclear spectrum, in red the LArr nuclear spectrum, and in blue the spectrum from the cluster-rich region to the south of the nucleus. The spectra are normalized by the flux at 5500 Å, and an offset is applied to better visualize the differences.
Current usage metrics show cumulative count of Article Views (full-text article views including HTML views, PDF and ePub downloads, according to the available data) and Abstracts Views on Vision4Press platform.
Data correspond to usage on the plateform after 2015. The current usage metrics is available 48-96 hours after online publication and is updated daily on week days.
Initial download of the metrics may take a while.