Fig. A.2
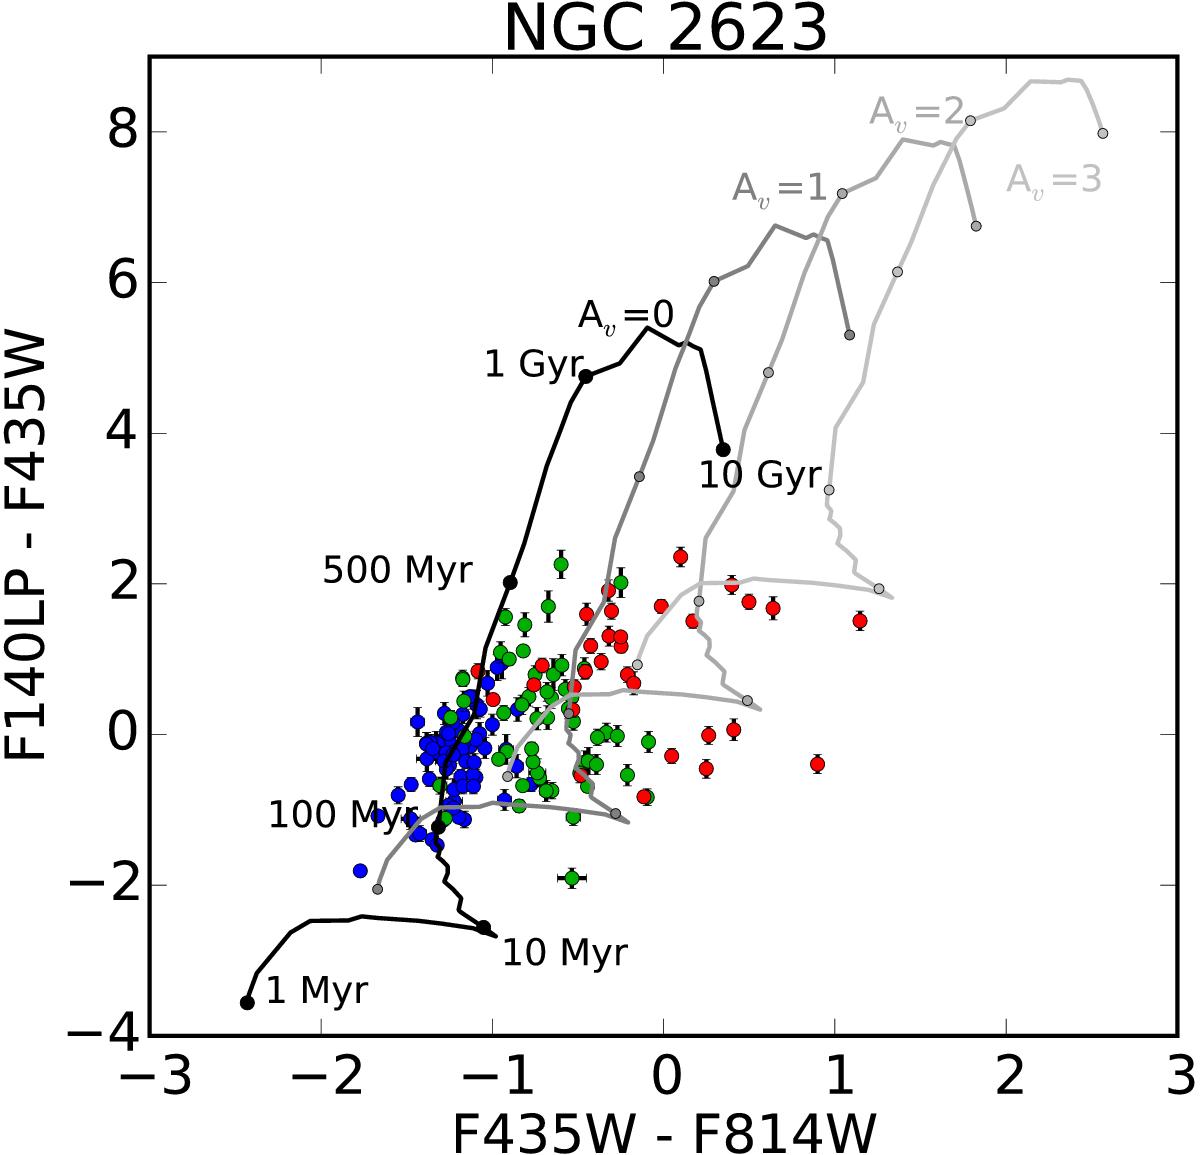
FUV−F435W vs. F435W−F814W diagram for NGC 2623 clusters. The color coding is the same as in Figure A.1, but only those clusters with S/N> 5 in FUV, F435W, and F814W filters are included in the plots. The black solid line is the path described by SSPs from 1 Myr to 13 Gyr, Z⊙, and AV = 0 mag. The gray-scale lines are the paths for the same models reddened by 1 to 3 mag, with the lighter shades tracing the more extincted models.
Current usage metrics show cumulative count of Article Views (full-text article views including HTML views, PDF and ePub downloads, according to the available data) and Abstracts Views on Vision4Press platform.
Data correspond to usage on the plateform after 2015. The current usage metrics is available 48-96 hours after online publication and is updated daily on week days.
Initial download of the metrics may take a while.