Fig. A.1
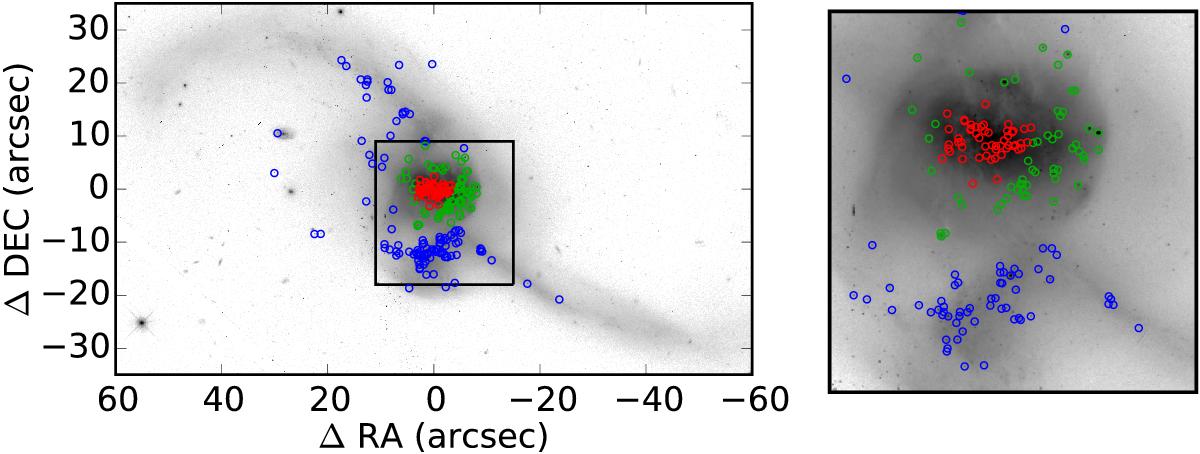
F814W image of NGC 2623. North is up, East is left. The detected clusters are marked with apertures of different colors corresponding to their distances with respect to the center: 1) blue clusters are those with d> 1 HLR, 2) green clusters if 0.5 HLR <d ≤ 1 HLR, and 3) red clusters if d< 0.5 HLR. In the left panel the whole galaxy is shown, where the black rectangle indicates the region simultaneously covered by all the filters from UV to NIR. A zoom into this region is shown in the right panel.
Current usage metrics show cumulative count of Article Views (full-text article views including HTML views, PDF and ePub downloads, according to the available data) and Abstracts Views on Vision4Press platform.
Data correspond to usage on the plateform after 2015. The current usage metrics is available 48-96 hours after online publication and is updated daily on week days.
Initial download of the metrics may take a while.