Fig. 15
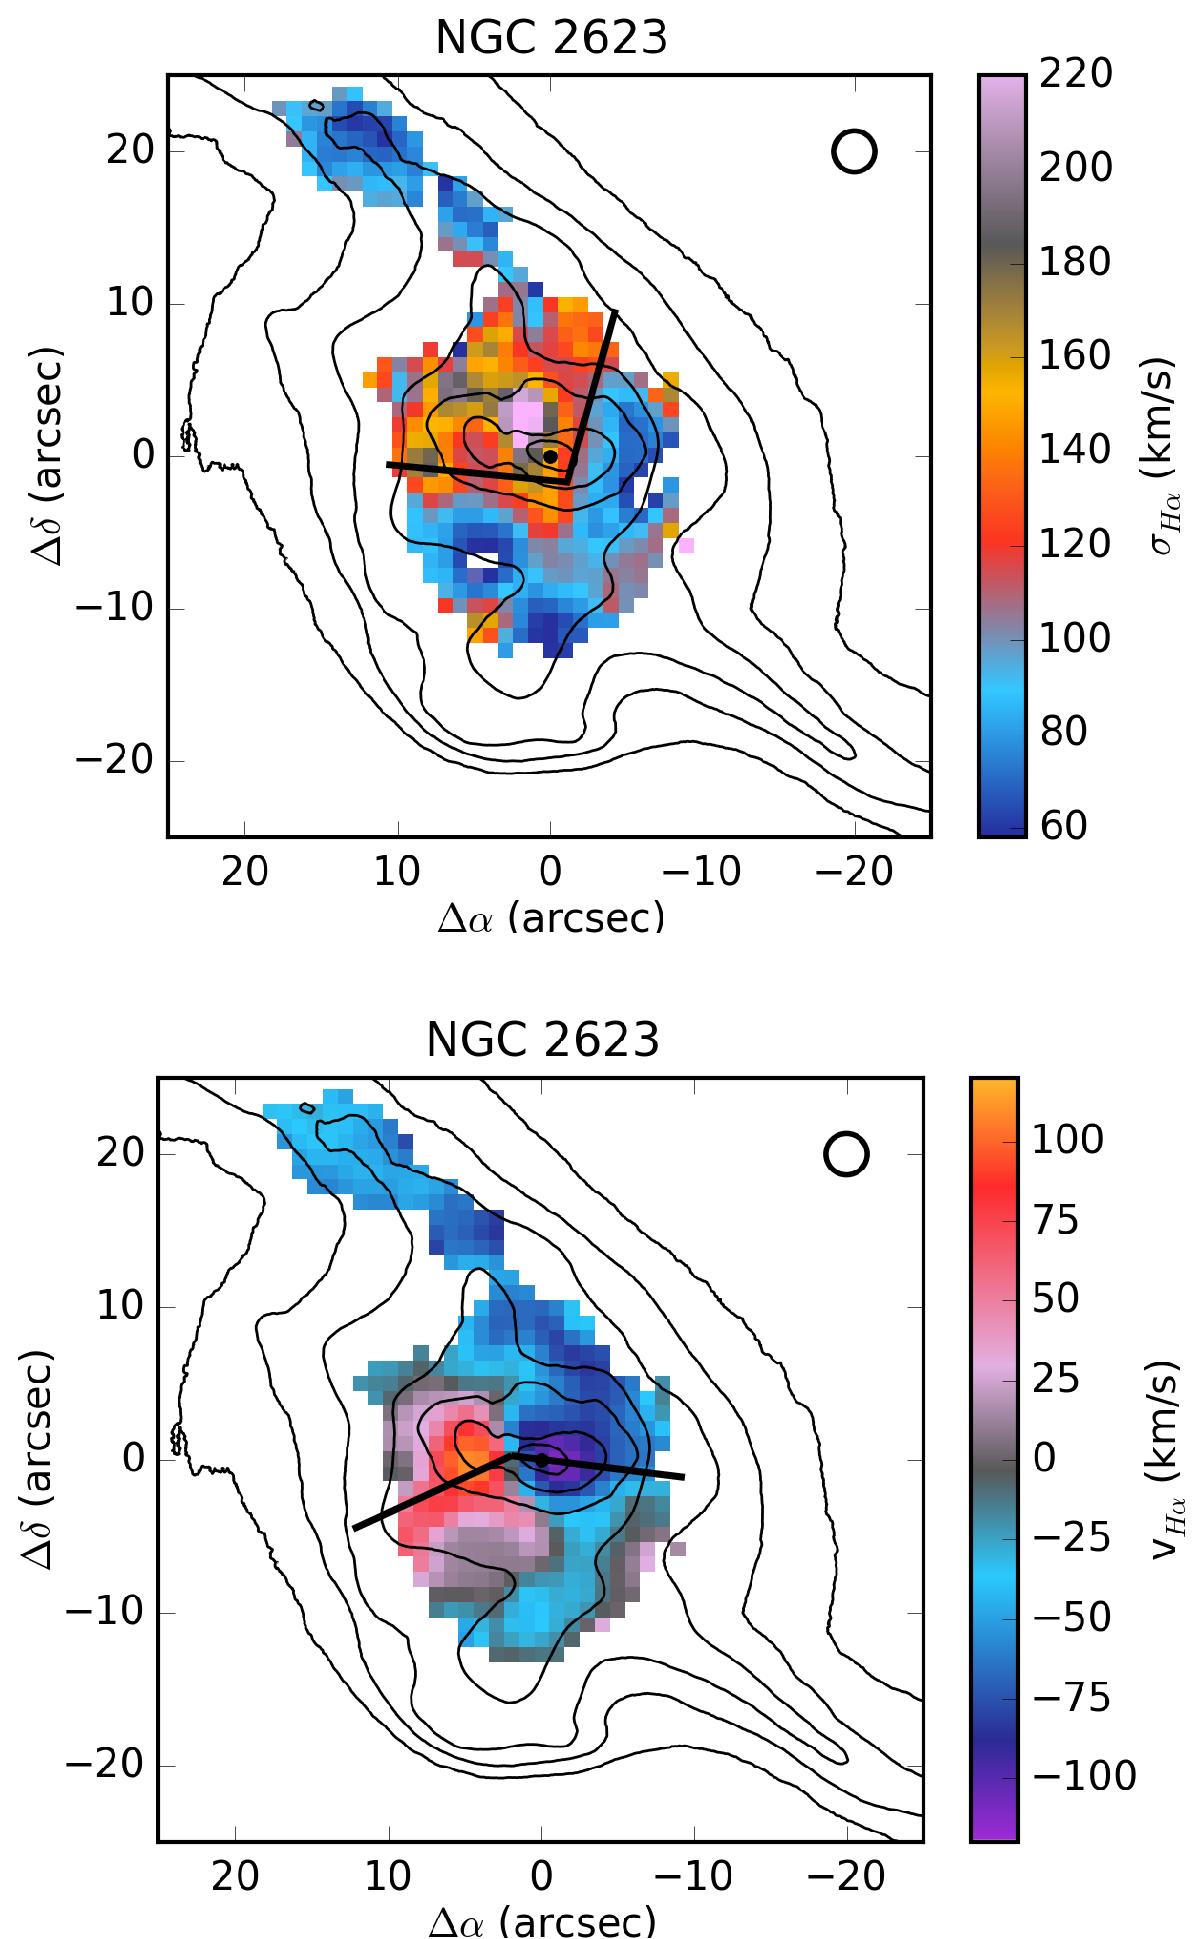
Top panel: velocity dispersion derived from Hα, corrected for the instrumental width (σinst ~ 116 km s-1). Bottom panel: velocity field derived from Hα. The position angles of the kinematic major axis for the approaching and receding sides have been calculated by Barrera-Ballesteros et al. (2015) and are shown in the figure with black solid lines. The circle in the top right corner of both maps represents the spatial resolution, given by the diameter of PPaK fibres, ~2.7′′.
Current usage metrics show cumulative count of Article Views (full-text article views including HTML views, PDF and ePub downloads, according to the available data) and Abstracts Views on Vision4Press platform.
Data correspond to usage on the plateform after 2015. The current usage metrics is available 48-96 hours after online publication and is updated daily on week days.
Initial download of the metrics may take a while.