Fig. 14
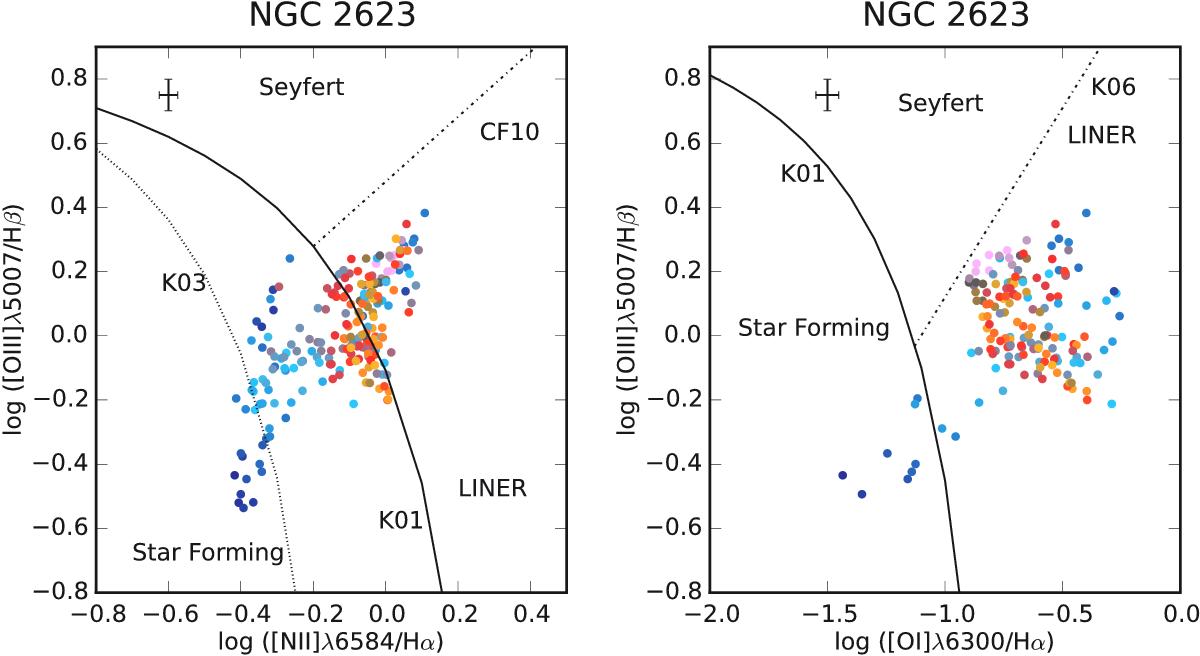
[NII]λ6584/Hα vs. [OIII]λ5007/Hβ (left panel), and [OI]λ6300/Hα vs. [OIII]λ5007/Hβ (right panel) line ratio diagnostic diagrams. Spaxels are color-coded according to the Hα velocity dispersion map shown in Fig. 15. Solid lines in both diagnostic diagrams mark the “maximum starburst lines” obtained by Kewley et al. (2001, K01) by means of photoionization models of synthetic starbursts; the dotted line in the left panels marks the pure SDSS star-forming galaxies frontier semi-empirically drawn by Kauffmann et al. (2003, K03); and the dashed-dotted lines that separate Seyferts from LINERs are from Cid Fernandes et al. (2010, CF10) and Kewley et al. (2006, K06). The average error bars are shown in the top-left corners.
Current usage metrics show cumulative count of Article Views (full-text article views including HTML views, PDF and ePub downloads, according to the available data) and Abstracts Views on Vision4Press platform.
Data correspond to usage on the plateform after 2015. The current usage metrics is available 48-96 hours after online publication and is updated daily on week days.
Initial download of the metrics may take a while.