Free Access
Fig. 11
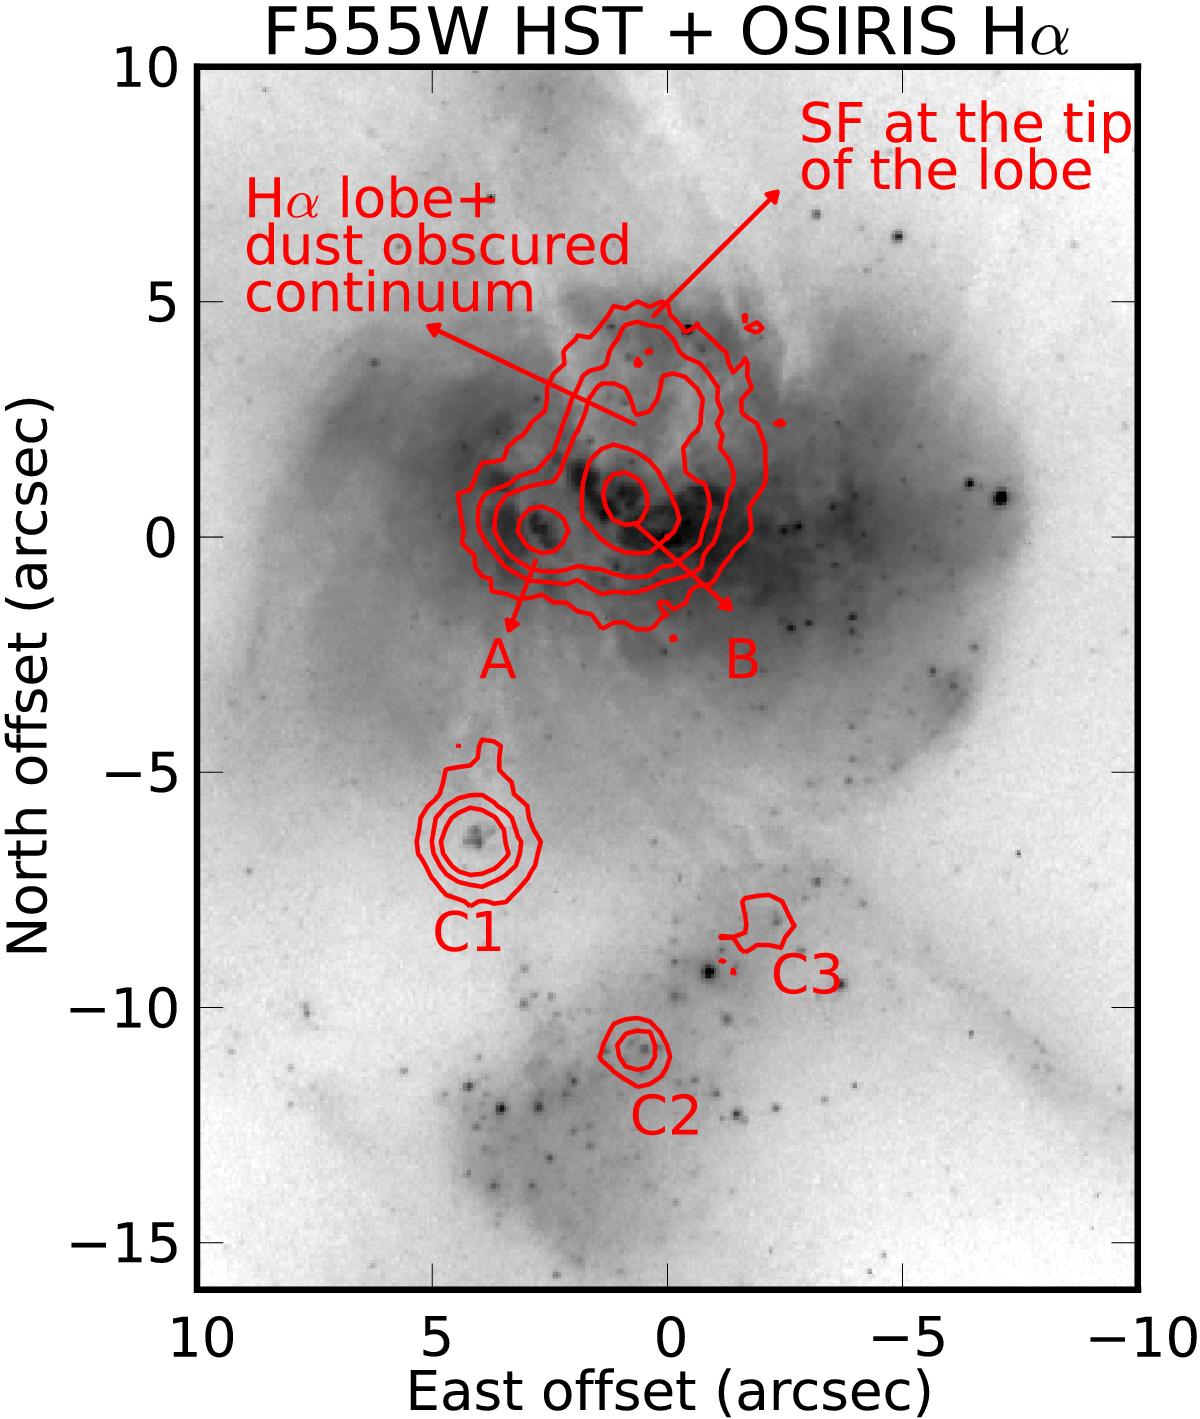
HST F555W continuum image of the nuclear region of NGC 2623 together with the OSIRIS Hα line emission plotted as red contours. The star cluster aggregations, A and B, and the HII regions, C1, C2, and C3 are labelled. The positions of the Hα lobe and SF associated to the tip of the lobe are also marked.
Current usage metrics show cumulative count of Article Views (full-text article views including HTML views, PDF and ePub downloads, according to the available data) and Abstracts Views on Vision4Press platform.
Data correspond to usage on the plateform after 2015. The current usage metrics is available 48-96 hours after online publication and is updated daily on week days.
Initial download of the metrics may take a while.