Free Access
Fig. 10
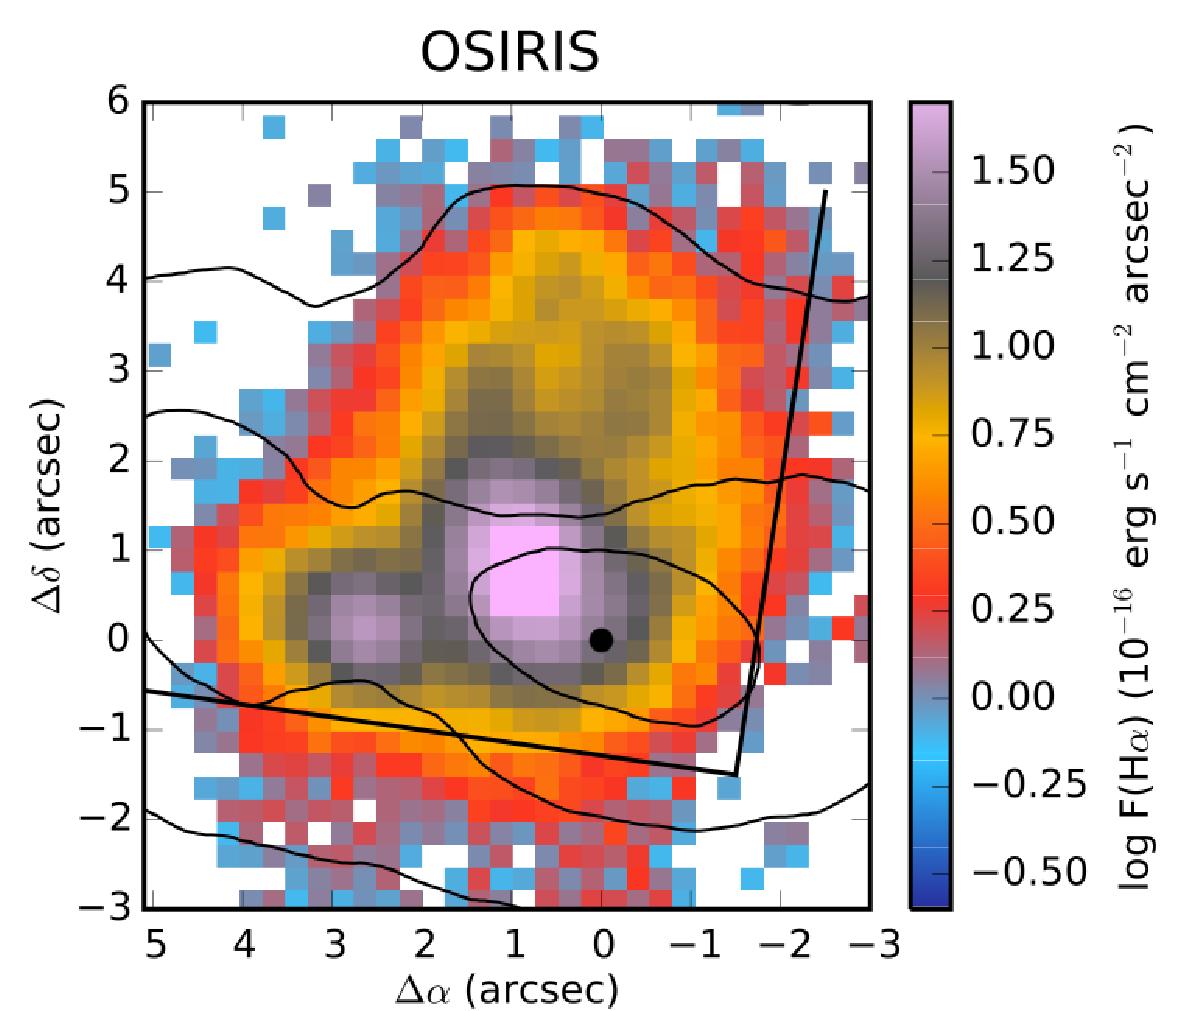
Zoom of the OSIRIS Hα emission line image for the nuclear region of NGC 2623. HST continuum contours are overplotted in black. The black dot marks the continuum center.
Current usage metrics show cumulative count of Article Views (full-text article views including HTML views, PDF and ePub downloads, according to the available data) and Abstracts Views on Vision4Press platform.
Data correspond to usage on the plateform after 2015. The current usage metrics is available 48-96 hours after online publication and is updated daily on week days.
Initial download of the metrics may take a while.