Fig. 4
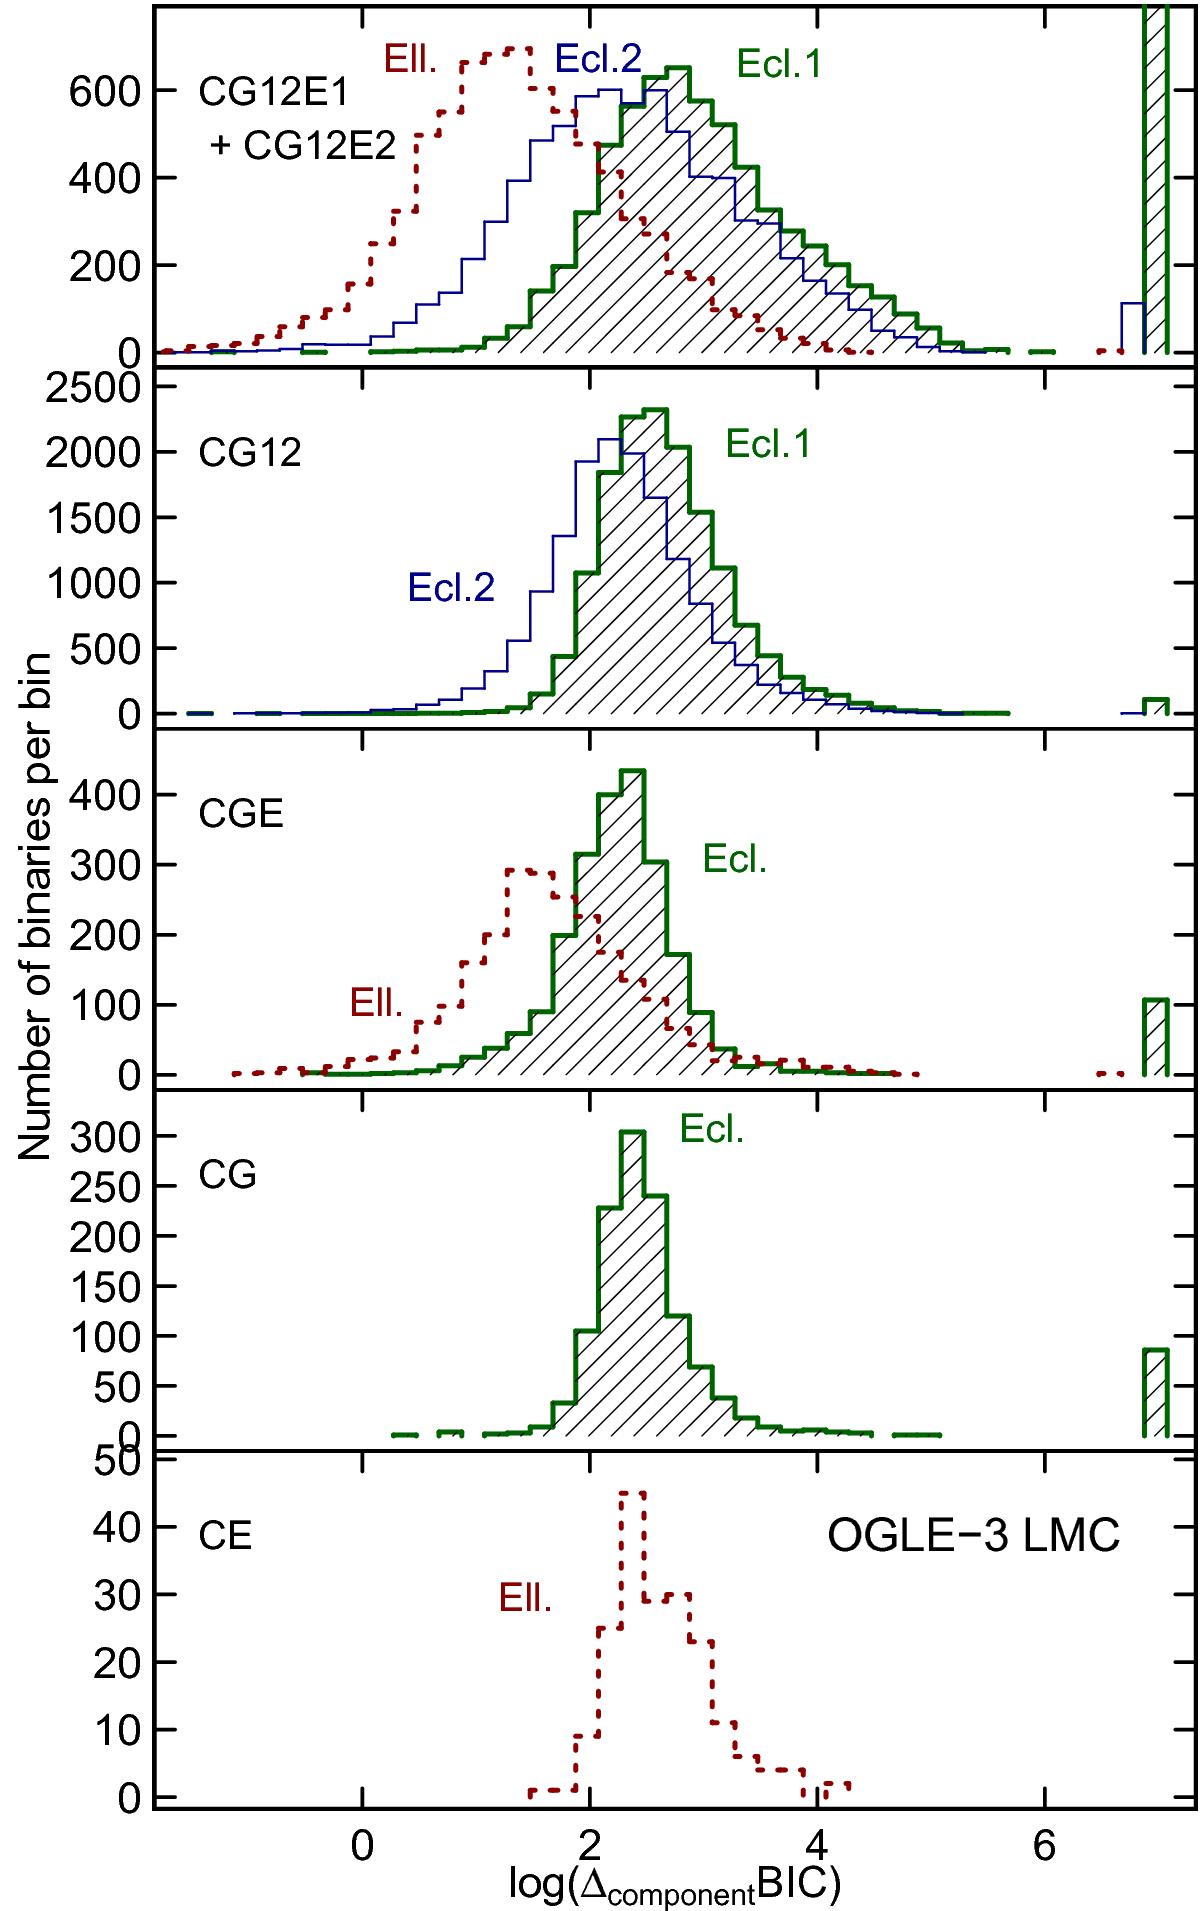
Distributions of the BIC value differences between the best model chosen by the automated two-Gaussian procedure and the alternative model without eclipse 1 (thick green hatched histogram), the alternative model without eclipse 2 (thin blue histogram), and the alternative model without the ellipsoidal component (dashed red histogram). The distributions are shown for best models that contain two Gaussians and an ellipsoidal-like component (top panel), two Gaussians only (second panel from top), one Gaussian and an ellipsoidal-like component (third panel from top), one Gaussian only (fourth panel from top), and an ellipsoidal-like component only (bottom panel). The histograms are plotted as a function of the logarithm (base 10) of the BIC value differences, with a bin width of 0.2. The number of models for which the alternative model did not converge or had a negative infinite BIC value is shown on the right of each panel at an x-axis value of 7 (for the eclipse 1 component), 6.8 (for the eclipse 2 component) and 6.6 (for the ellipsoidal component). In the top panel, the Y-axis is limited to 700 for a better visibility, 1299 models having no alternative model without eclipse 1.
Current usage metrics show cumulative count of Article Views (full-text article views including HTML views, PDF and ePub downloads, according to the available data) and Abstracts Views on Vision4Press platform.
Data correspond to usage on the plateform after 2015. The current usage metrics is available 48-96 hours after online publication and is updated daily on week days.
Initial download of the metrics may take a while.