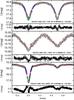
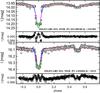
Fig. 17

Examples of various folded light curves in region B of the ![]() versus
versus ![]() diagram, with the residual folded light curve of each source plotted in a smaller panel below the panel of each folded light curve. The colors of the models are the same as in Fig. 6. The three top examples, ordered from top to down with increasing
diagram, with the residual folded light curve of each source plotted in a smaller panel below the panel of each folded light curve. The colors of the models are the same as in Fig. 6. The three top examples, ordered from top to down with increasing ![]() values, illustrate cases where Gaussian or cosine functions are not adequate enough to describe the light curve geometries of the eclipses or inter eclipses variability. The two bottom examples illustrate cases that require an additional physical effect not taken into account in the current two-Gaussian models. The upper example shows a case with a total eclipse, and the lower example a case with reflection. The positions of the sources in the
values, illustrate cases where Gaussian or cosine functions are not adequate enough to describe the light curve geometries of the eclipses or inter eclipses variability. The two bottom examples illustrate cases that require an additional physical effect not taken into account in the current two-Gaussian models. The upper example shows a case with a total eclipse, and the lower example a case with reflection. The positions of the sources in the ![]() versus
versus ![]() diagram are shown in Fig. 15.
diagram are shown in Fig. 15.
Current usage metrics show cumulative count of Article Views (full-text article views including HTML views, PDF and ePub downloads, according to the available data) and Abstracts Views on Vision4Press platform.
Data correspond to usage on the plateform after 2015. The current usage metrics is available 48-96 hours after online publication and is updated daily on week days.
Initial download of the metrics may take a while.