Fig. 4
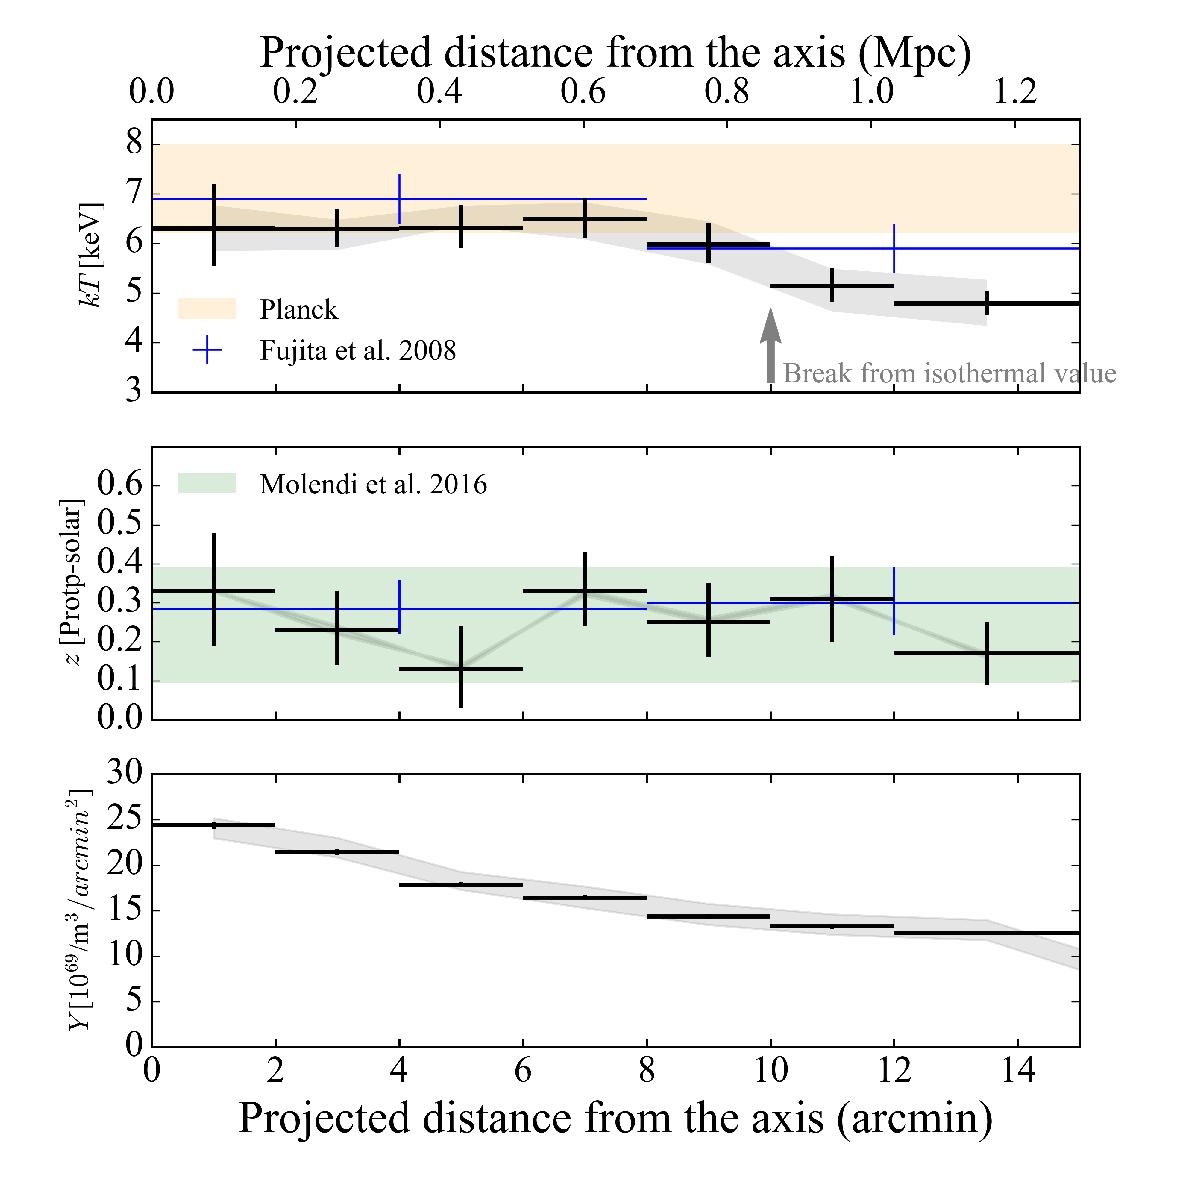
Top: profiles of the temperature of the filamentary structure as a function of the projected distance from the collision axis shown in Fig. 1. Black crosses indicate the Suzaku best-fit values with statistical errors. The blue crosses show the previous measurements by Fujita et al. (2008), with converted 1σ errors. The light orange shaded area represents the temperature estimated by Planck (Planck Collaboration VIII 2013). Middle: radial profiles of the abundance are shown. Colors are same as in the top panel except for the light green shaded area, which shows the best constrained limits of the Fe abundance at cluster outskirts derived by Molendi et al. (2016). Bottom: same as the top panel but for the normalization of the IGM component. The range of uncertainties due to the 30% fluctuation in the CXB is shown by the gray shaded region.
Current usage metrics show cumulative count of Article Views (full-text article views including HTML views, PDF and ePub downloads, according to the available data) and Abstracts Views on Vision4Press platform.
Data correspond to usage on the plateform after 2015. The current usage metrics is available 48-96 hours after online publication and is updated daily on week days.
Initial download of the metrics may take a while.