Fig. 3
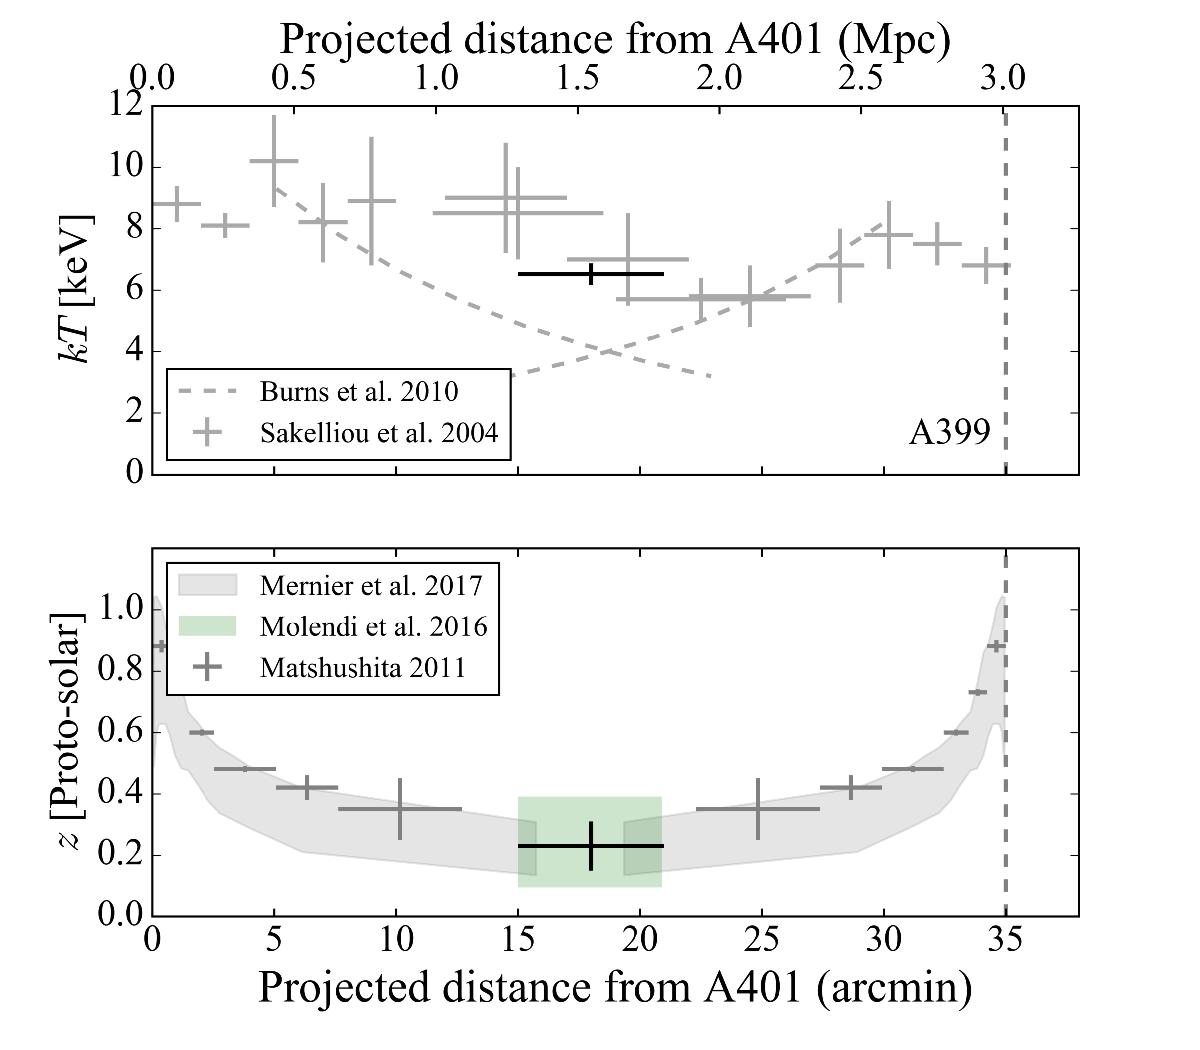
Top: radial profiles of the temperature of the ICM and filamentary plasma. The Suzaku best-fit value and statistical errors are shown with the black cross. The gray crosses show the previous XMM-Newton measurements by Sakelliou & Ponman (2004), with converted 1σ errors. The gray dashed curves show “universal” temperature profiles (Burns et al. 2010). The gray dashed vertical line shows the approximate position of A399. Bottom: radial profiles of the abundance are shown. All values are converted into Lodders et al. (2009). The gray shaded area (scatter of the sample) and crosses represent the Fe abundance profiles reported by Mernier et al. (2017) and Matsushita (2011), respectively. The green shaded area shows the conservative prediction of the abundance at cluster outskirts by Molendi et al. (2016).
Current usage metrics show cumulative count of Article Views (full-text article views including HTML views, PDF and ePub downloads, according to the available data) and Abstracts Views on Vision4Press platform.
Data correspond to usage on the plateform after 2015. The current usage metrics is available 48-96 hours after online publication and is updated daily on week days.
Initial download of the metrics may take a while.