| Issue |
A&A
Volume 606, October 2017
|
|
|---|---|---|
| Article Number | A38 | |
| Number of page(s) | 11 | |
| Section | Planets and planetary systems | |
| DOI | https://doi.org/10.1051/0004-6361/201730471 | |
| Published online | 05 October 2017 | |
Tracking Advanced Planetary Systems (TAPAS) with HARPS-N
V. A Massive Jupiter orbiting the very-low-metallicity giant star BD+03 2562 and a possible planet around HD 103485⋆,⋆⋆
1 Departamento de Física Teórica, Universidad Autónoma de Madrid, Cantoblanco, 28049 Madrid, Spain
e-mail: This email address is being protected from spambots. You need JavaScript enabled to view it.
2 Toruń Centre for Astronomy, Faculty of Physics, Astronomy and Applied Informatics, Nicolaus Copernicus University in Toruń, Grudziadzka 5, 87-100 Toruń, Poland
e-mail: This email address is being protected from spambots. You need JavaScript enabled to view it.
3 Department of Astronomy and Astrophysics, Center for Exoplanets and Habitable Worlds, Pennsylvania State University, 525 Davey Laboratory, University Park, PA 16802, USA
4 Instituto de Astrofísica de Canarias, 38205 La Laguna, Tenerife, Spain
5 Departamento de Astrofísica, Universidad de La Laguna, 38206 La Laguna, Tenerife, Spain
6 National Center for Supercomputing Applications, University of Illinois, Urbana-Champaign, 1205 W Clark St, MC-257, Urbana, IL 61801, USA
7 McDonald Observatory and Department of Astronomy, University of Texas at Austin, 2515 Speedway, Stop C1402, Austin, TX, 78712-1206, USA
8 INAF–Osservatorio Astronomico di Palermo, Piazza del Parlamento 1, 90134 Palermo, Italy
Received: 20 January 2017
Accepted: 31 May 2017
Abstract
Context. Evolved stars with planets are crucial to understanding the dependency of the planet formation mechanism on the mass and metallicity of the parent star and to studying star-planet interactions.
Aims. We present two evolved stars (HD 103485 and BD+03 2562) from the Tracking Advanced PlAnetary Systems (TAPAS) with HARPS-N project devoted to RV precision measurements of identified candidates within the PennState – Toruń Centre for Astronomy Planet Search.
Methods. The paper is based on precise radial velocity (RV) measurements. For HD 103485 we collected 57 epochs over 3317 days with the Hobby-Eberly Telescope (HET) and its high-resolution spectrograph and 18 ultra-precise HARPS-N data over 919 days. For BD+03 2562 we collected 46 epochs of HET data over 3380 days and 19 epochs of HARPS-N data over 919 days.
Results. We present the analysis of the data and the search for correlations between the RV signal and stellar activity, stellar rotation, and photometric variability. Based on the available data, we interpret the RV variations measured in both stars as Keplerian motion. Both stars have masses close to Solar (1.11 M⊙ HD 103485 and 1.14 M⊙ BD+03 2562), very low metallicities ([Fe/H] = − 0.50 and − 0.71 for HD 103485 and BD+03 2562), and both have Jupiter planetary mass companions (m2sini = 7 and 6.4 MJ for HD 103485 and BD+03 2562 resp.) in close to terrestrial orbits (1.4 au HD 103485 and 1.3 au BD+03 2562) with moderate eccentricities (e = 0.34 and 0.2 for HD 103485 and BD+03 2562). However, we cannot totally rule-out the possibility that the signal in the case of HD 103485 is due to rotational modulation of active regions.
Conclusions. Based on the current data, we conclude that BD+03 2562 has a bona fide planetary companion while for HD 103485 we cannot totally exclude the possibility that the best explanation for the RV signal modulations is not the existence of a planet but stellar activity. If the interpretation remains that both stars have planetary companions, they represent systems orbiting very evolved stars with very low metallicities, a challenge to the conditions required for the formation of massive giant gas planets.
Key words: planets and satellites: detection / stars: evolution / stars: late-type / planet-star interactions
Based on observations obtained with the Hobby-Eberly Telescope, which is a joint project of the University of Texas at Austin, the Pennsylvania State University, Stanford University, Ludwig-Maximilians-Universität München, and Georg-August-Universität Göttingen.
Based on observations made with the Italian Telescopio Nazionale Galileo (TNG) operated on the island of La Palma by the Fundación Galileo Galilei of the INAF (Istituto Nazionale di Astrofisica) at the Spanish Observatorio del Roque de los Muchachos of the Instituto de Astrofísica de Canarias.
© ESO, 2017
1. Introduction
With the discovery of 51 Peg (Mayor & Queloz 1995), we arrived at the realisation that planet formation as we understood it had to be revised to account for the existence of “hot Jupiters”. Since then, every planetary system discovered has added to our understanding of the physics of planet formation (e.g., Udry & Santos 2007). In this regard, planets orbiting evolved stars hold the key to several processes related not only to how planet formation operates around stars more massive than the Sun but also to understand star-planet interactions (Villaver & Livio 2007; Villaver et al. 2014; Privitera et al. 2016c,a). In this context, planets around evolved stars have revealed a lack of hot Jupiters that most likely reflect effects induced by stellar evolution (Villaver & Livio 2009; Mustill & Villaver 2012; Villaver et al. 2014; Privitera et al. 2016b).
In the main sequence, the presence of giant planets has shown to be very sensitive to the metallicity [Fe/H] of the host star (Gonzalez 1997; Santos et al. 2004; Fischer & Valenti 2005). The precise functional form of the correlation still remain elusive, despite the fact that it is one of the fundamental parameters in helping to constrain the planet-formation models (e.g., Mordasini et al. 2012). Most importantly, however, the evolved hosts of planets have been shown to present some chemical peculiarities with respect to their main sequence counterparts (e.g., Pasquini et al. 2007; da Silva et al. 2006; Ghezzi et al. 2010; Maldonado et al. 2013; Mortier et al. 2013; Jofré et al. 2015; Jones et al. 2014; Reffert et al. 2015; Maldonado & Villaver 2016). In particular, the planet occurrence rate does seem to depend on both stellar mass and stellar metallicity (Maldonado et al. 2013) and cannot be explained by sample contamination (Maldonado & Villaver 2016) as has been argued by Reffert et al. (2015).
The established picture of giant planet formation, the basis of the core accretion model (Perri & Cameron 1974; Cameron 1978; Mizuno 1980; Pollack et al. 1996), begins with the building of km-sized or larger planetesimals from the growth of 1−10 mm pebbles (see e.g. Youdin 2011; Simon et al. 2016). The planetesimals growth continues until a solid core, big enough for gravity to accrete gas from the protoplanetary disk, is formed. The metallicity dependency in the core accretion model thus comes from the need for fast core growth before disk dissipation occurs (Ida & Lin 2004). Furthermore, it has been shown that the alternative scenario, giant planet formation via gravitational instability in the protoplanetary disk (Boss 1997; Mayer et al. 2002; Boss 2004) does not carry a metallicity dependency that can explain the observed relation.
Over the last ≈ 10 years we have embarked on a quest for the discovery of substellar/planetary companions to giant stars that started with the PennState – Toruń Centre for Astronomy Planet Search (PTPS, Niedzielski et al. 2007; Niedzielski & Wolszczan 2008; Niedzielski et al. 2015b, 2016a) program and has continued with the high precision RV follow up of previous selected PTPS candidates program Tracking Advanced Planetary Systems (TAPAS) program with HARPS-N (Niedzielski et al. 2015a; Adamów et al. 2015; Niedzielski et al. 2016b,c). In this paper, we present the latest finding of our TAPAS program: two very evolved giant stars with very low metallicities, with a massive Jupiter orbiting one of them and a possible planet orbiting the other one and thus represent rather extreme outliers to the general planet-metallicity relation.
The paper is organised as follows: a summary of the observations, radial velocity, and activity measurements is given in Sect. 2 together with a description of the general procedure and the basic properties of the two stars; in Sects. 3 and 4 we show the analysis of the stellar rotation and photometry together with a discussion of the activity indicators; in Sect. 5 we present the Keplerian analysis of the radial velocity measurements, and our results are summarized and discussed further in Sect. 6.
2. Observations, radial velocities, line bisectors, and activity indicators
HD 103485 (BD+02 2493) and BD+03 2562 (TYC 0276-00507-1) belong to a sample of about 300 planetary or brown dwarf (BD) candidates identified from a sample of about 1000 stars examined for radial velocity (RV) variations with the 9.2 m Hobby-Eberly Telescope (HET, Ramsey et al. 1998). The full sample has been monitored since 2004 using the high-resolution spectrograph (HRS, Tull 1998) at HET within the PTPS program. Targets were selected for a more intense and precise RV follow-up within the TAPAS program with the High Accuracy Radial velocity Planet Searcher in the north hemisphere (HARPS-N, Cosentino et al. 2012).
The spectroscopic observations presented in this paper are thus a combination of data taken with the HRS at HET in the queue scheduled mode (Shetrone et al. 2007), and with HARPS-N at the 3.58 m Telescopio Nazionale Galileo (TNG).
For HET HRS spectra we use a combined gas-cell (Marcy & Butler 1992; Butler et al. 1996), and cross-correlation (Queloz 1995; Pepe et al. 2002) method for precise RV and spectral bisector inverse slope (BIS) measurements, respectively. The implementation of this technique to our data is described in Nowak (2012) and Nowak et al. (2013).
HARPS-N radial velocity measurements and their uncertainties as well as BIS measurements were obtained with the standard user pipeline, which is based on the weighted CCF method (Fellgett 1955; Griffin 1967; Baranne et al. 1979; Queloz 1995; Baranne et al. 1996; Pepe et al. 2002), using the simultaneous Th-Ar calibration mode of the spectrograph and the K5 cross-correlation mask.
A summary of the available data for HD 103485 and BD+03 2562 is given in Tables 1 and 2, respectively.
Summary of the available data on HD 103485.
Summary of the available data on BD+03 2562.
2.1. RV and BIS
The 57 epochs of HET/HRS data for HD 103485 show RV variations of 553 m s-1 with average uncertainty of 5.6 m s-1 and BIS variations of 104 m s-1 with an average uncertainty of 16 m s-1. No correlation between RV and BIS exists (Pearson’s r = 0.09). HARPS-N RV 18 epochs of data show an amplitude of 553 m s-1 (average uncertainty of 1.7 m s-1). The BIS shows a peak-to-peak amplitude of 85 m s-1 and no correlation with RV (r = − 0.02). Lomb-Scargle (LS) periodogram analysis (Lomb 1976; Scargle 1982; Press et al. 1992) of combined HET/HRS and HARPS-N RV data reveals a strong periodic signal in RV at 557 days.
For BD+03 2562 the 46 epochs of HET/HRS data show RV variations of 575 m s-1 with average uncertainty of 7 m s-1 and BIS variations of 136 m s-1 with average uncertainty of 22 m s-1. The 19 epochs of HARPS-N data show RV amplitude of 444 m s-1 and average uncertainty of 2.1 m s-1. The BIS shows a peak-to-peak amplitude of 58 m s-1. There is no correlation between RV and BIS in either HET/HRS data (r = 0.23) or HARPS-N (r = 0.13) data. A strong periodic signal in RV at 482 days appears in the LS periodogram analysis of combined HET/HRS and HARPS-N RV data.
HET/HRS and HARPS-N BIS have to be considered separately due to their different definition (see Niedzielski et al. 2016b, for more details). The RV and BIS data for both stars are presented in Tables A.1, A.3, A.2 and A.4.
2.2. Activity indicators: the Ca H&K lines
The Ca II H and K line profiles (see Noyes et al. 1984; Duncan et al. 1991) and the reversal profile, typical for active stars (Eberhard & Schwarzschild 1913), are widely accepted as stellar activity indicators. The Ca II H and K lines are only available to us in the TNG HARPS-N spectra. The signal-to-noise of our red giants in that spectral range is low, 3−5 in this particular case, but we found no trace of reversal. To quantify the observations, we calculated an instrumental  index according to the prescription of Duncan et al. (1991) for HARPS-N data. The index for TNG HARPS-N spectra was calibrated to the Mt Wilson scale with the formula given by Lovis et al. (2011). For HD 103485, we obtained a value of 0.20 ± 0.05 and for BD+03 2562 of 0.14 ± 0.07, rather typical values for non-active stars.
The for both stars show no statistically significant correlation with the RV (r = − 0.41 and r = − 0.25, respectively). In order to examine the possible correlation in more detail we have performed further statistical Bayesian tests following the prescription given in Figueira et al. (2016). For HD 103485, the Pearson’s coefficient of the data is 0.408 with a 0.093 two-sided p-value and the Spearman’s rank coefficient is 0.514 (0.029 two-sided p-value). The distribution of the parameter of interest, ρ, characterizing the strength of the correlation is 0.327 with a standard deviation of 0.187 and 95% credible interval [−0.049, 0.663]. For BD+03 2562 the Pearson’s coefficient is 0.254, 0.310 two-sided p-value and the Spearman’s rank coefficient 0.051 with a 0.841 two-sided p-value. ρ = 0.2 with a 0.197 and 95% credible interval [−0.201, 0.559]. For both stars a correlation is not conclusively seen and seems unlikely, with the 95% credible interval lower limit being above ρ = 0. However, a note of warning is due here given that in the case of rotational modulation, non-linear relations are expected between RV and activity. This is caused by a phase shift between the activity maximum (that occurs when the active regions are at the center of the disk) and the maximum RV effect, that happens at a phase of ≈60°.
Thus, we conclude that the Ca II H and K line profile analysis reveals that, over the period covered by TNG observations, both giants are quite inactive and there is no trace of activity influence upon the observed RV variations.
2.3. Activity indicators: Hα analysis
Cincunegui et al. (2007) showed that the calcium and hydrogen line indices do not always correlate and cannot be used interchangeably as activity indicators. We thus measured the Hα activity index (IHα) in both HET/HRS and TNG/HARPS-N spectra, following the procedure described in detail by Maciejewski et al. (2013), which is based on the approach presented by Gomes da Silva et al. (2012) and Robertson et al. (2013, and references therein). We also measured the index in the Fe I 6593.883 Å control line (IFe), which is insensitive to stellar activity, to take possible instrumental effects into account. Moreover, in the case of HET/HRS spectra, that may still contain weak I2 lines in the wavelength regime relevant to the Hα and Fe I 6593.883 Å lines, we also measured the Hα and Fe I indices for the iodine flat-field spectra (II2,Hα and II2,Fe, respectively).
2.3.1. BD+03 2562
The marginal rms variations of the II2,Hα = 0.11% and II2,Fe = 0.33% in comparison to the relative scatter of IHα,HRS = 3.03% and IFe,HRS = 1.08% assure us of the negligible contribution of the weak iodine lines to Hα and Fe I 6593.883 Å line indices measured from HET/HRS spectra of BD+03 2562. The rms variation of Hα activity index measured from 18 TNG/ HARPS-N spectra is slightly larger than the one measured from the HET/HRS spectra (IHα,HARPS − N = 3.68%). The rms variation of TNG/HARPS-N Fe I 6593.883 Å line index is more than two times larger than that measured from HET/HRS spectra (IFe,HARPS − N = 2.39%). The larger rms variations of the line indices measured from the TNG/HARPS-N spectra compared to the HET/HRS spectra measurements might be a consequence of the lower SNR of the TNG/HARPS-N spectra (40−70), compared to that of the HET/HRS spectra (120−220). There is no correlation between either HET/HRS IHα, HRS and RVs (the Pearson coefficient, r = 0.27), or between TNG/HARPS-N IHα,HARPS − N and RVs (the same value of r = 0.27). There is also no significant signal in the Lomb-Scargle periodograms of BD+03 2562 Hα indices.
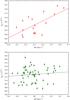 |
Fig. 1 Hα activity index of HD 103485 measured from TNG/HARPS-N spectra (top panel) and from HET/HRS ones (lower panel). Solid lines present linear fits to the data. Although Hα activity index measured from HET/HRS does not present correlation with HET/HRS radial velocities, the one measured from TNG/HARPS-N spectra shows clear correlation with TNG/HARPS-N radial velocities. |
2.3.2. HD 103485
The iodine flat-field HET/HRS spectra of HD 103485 show marginal rms variations (II2,Hα = 0.1% and II2,Fe = 0.13%) in the Hα and Fe I 6593.883 Å indices. Comparing to the relative scatter of Hα and Fe I indices (IHα,HRS = 3.16% and IFe,HRS = 0.79%) we are assured of the negligible contribution of the weak iodine lines to Hα and Fe I 6593.883 Å line indices. The Pearson coefficient between HET/HRS Hα index and RVs is r = 0.11. The rms variations of Hα and Fe I 6593.883 Å line indices measured from 18 TNG/HARPS-N spectra are similar to those measured for BD+03 2562: IHα,HARPS − N = 3.86% and IFe,HARPS − N = 2.73%. However, the Pearson coefficient between TNG/HARPS-N Hα index and RVs r = 0.66, while the critical value of the Pearson correlation coefficient at the confidence level of 0.01 r16,0.01 = 0.59. On the other hand, this value (r = 0.66) is lower than the critical value of the Pearson correlation coefficient at the confidence level of 0.001 (r16,0.001 = 0.71). Given the small number of epochs, the correlation may very well be spurious. The Hα indices versus HET/HRS and TNG/HARPS-N radial velocities are presented in Fig. 1. Figure 2 presents the TNG/HARPS-N radial velocity and Hα activity index curves of HD 103485 and Fig. 3 presents LS periodograms of TNG/HARPS-N and HET/HRS radial velocities and Hα indices.
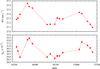 |
Fig. 2 TNG/HARPS-N radial velocity and Hα activity index curves of HD 103485. |
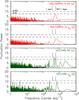 |
Fig. 3 LS periodograms of a) TNG/HARPS-N RVs, b) TNG/HARPS-N Hα activity index, c) HET/HRS RVs, and d) HET/HRS Hα activity index of HD 103485. The levels of FAP = 1.0% and 0.1% are shown. |
2.4. Wavelength dependence of the radial velocity signal
As both HD 103485 and BD+03 2562 exhibit significant scatter both in radial velocities and Hα activity indices, the unambiguous interpretation of their origin is very difficult. Therefore, we analysed the wavelength dependence of the radial velocity peak-to-peak amplitude (A). The value of A should be constant in the case of spectral shifts induced by the gravitational pull of the companion. In the case of a RV signal generated by the rotation of a spotted stellar photosphere, the value of A should decrease with increasing wavelength as the temperature difference between the stellar photosphere and a stellar spot decreases at longer wavelengths (e.g., Saar & Donahue 1997; Hatzes 2002; Desort et al. 2007).
Figure 4 shows “A”, the peak-to-peak RV amplitude as a function of the TNG/HARS-N order number for HD 103485, BD+03 2562, and the multiple planetary host PTPS target TYC 1422-00614-1 presented in Niedzielski et al. (2015a, TAPAS-I paper). TYC 1422-00614-1 does not show any significant stellar activity related to any of the two signals reported in its radial velocity curve. Therefore, it is a good benchmark to test the wavelength dependence of the radial velocity signal peak-to-peak amplitudes of the stars in this paper HD 103485 and BD+03 2562. As shown in Fig. 4, both HD 103485 and BD+03 2562 show chromatic dependence of “A”, although its unambiguous interpretation is not straightforward, especially if we note that the peak-to-peak RV amplitude is systematically higher in TNG/HARPS-N orders 10–16.
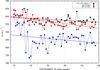 |
Fig. 4 Radial velocity peak-to-peak amplitude (A) as a function of TNG/HARPS-N order number. |
Equation (5) of Desort et al. (2007) gives the relation between the peak-to-peak amplitude of the RV variation (A), the projected rotation velocity of the star (vrotsini⋆) and the fraction of the visible hemisphere of the star that might be covered by the spot (parameter fr; we refer to Desort et al. 2007, for its definition and relation to the fraction of the projected area covered by the spot, fp, on the 2D stellar disk used by other authors). Using the above mentioned equation we computed the parameter fr for HD 103485 and BD+03 2562. As inputs in Eq. (5) we used the values of the projected rotation velocities of both stars from Tables 1 and 2 and the values of the K semi-amplitudes from Tables 3 and 4 (A is ≈2K). For HD 103485 we obtained fr = 5.93% and for BD+03 2562 fr = 5.71%. Then, using Eq. (6) of Desort et al. (2007), that gives the relation between the peak-to-peak amplitude of the bisector inverse slope peak-to-peak variation (S), the parameter fr, vrotsini⋆ and the instrumental width of the spectrograph (v0 = 3km s-1 for both HARPS and HAPRS-N), we computed the values of S for both of our targets. We obtain S = 96m s-1 for HD 103485 and S = 75.5m s-1 for BD+03 2562. The computed value of the peak-to-peak amplitude of bisector inverse slope for HD 103458 is consistent with its peak-to-peak amplitude of TNG/HARPS-N BIS (85m s-1, see Sect. 2.1), while in the case of BD+03 2562, it is significantly higher (we refer to Sect. 2.1. TNG/HARPS-N BIS for BD+03 2562 is 58 m s-1). We have to remember though, that Eqs. (5) and (6) were derived for main sequence K5-type stars and HD 103458 and BD+03 2562 are giant stars.
3. Stellar rotation and solar-like oscillations
The one sigma limit of the rotation period (Prot(sin i⋆)-1) is equal to 477 ± 134 days for HD 103485 and 606 ± 179 days for BD+03 2562. Thus, the true rotation period (Prot) of HD 103485 at one sigma is then lower than 611 days and Prot is lower than 785 days for BD+03 2562. Based on the upper limits of the rotation periods of HD 103485 and BD+03 2562 we then cannot exclude that the signals in their radial velocity curves are generated by rotational modulation of active photospheres.
The amplitudes (Vosc) and periods (Posc) of solar-like oscillations computed using Eqs. (7) and (10) of Kjeldsen & Bedding (1995) are equal to  m s-1 and
  days for HD 103485 and to
  m s-1 and
  days for BD+03 2562. Computed values of solar-like oscillation amplitudes are consistent with the values of stellar jitter (σjitter) and post-fit rms (rms) presented in Tables 3 and 4. Both stars exhibit extremely high stellar jitter.
4. Photometry and discussion of activity indicators
For HD 103485, two extensive sets of photometric observations are available from Hipparcos (Perryman et al. 1997; van Leeuwen 2007) and ASAS (Pojmanski 1997). 133 epochs of Hipparcos data were gathered over 1140 days between JD 2447878.4 and 2449019.0, long before our monitoring of this star. The average brightness is vHip = 8.422 ± 0.013 mag and they show no trace of variability. 392 epochs of ASAS photometry were collected between JD 2 451 871.9 and 2 455 040.5 (3169 days), partly during our HET observations. These show average brightness of vASAS = 8.281 ± 0.01 and the trace of a 27 d period, possibly due to the Moon. No significant photometric variability similar to that shown in RV is present in the available data as illustrated by the LS periodogram in Fig. 6.
BD+03 2562 was observed within ASAS over 3169 days between JD 2 451 871.9 and 2 455 040.5, partly covering the time-span of our HET observations. The average brightness is vASAS = 9.497 ± 0.015 mag and we find no trace of activity in these data (see Fig. 8).
The spectral line bisectors and the calcium H&K line shape show that we are dealing with a Keplerian motion that alters the position of the observed absorption lines in the spectra of both stars. Both weak and uncorrelated variations of Hα and the lack of photometric variability in the case of BD+03 2562 support that conclusion. In the case of HD 103485, the Hα variations, weakly correlated with the observed RV in the TNG/HARPS-N data, suggest that the observed RV variations may be due to a spot; but no such spot is visible in the photometric data, partly contemporaneous with our spectroscopic observations.
We can therefore conclude that, although in the case of HD 103485 the activity should be studied in more detail in the future, there exists no inexorable evidence that contradicts the interpretation of the observed RV variations as Doppler displacements due to the presence of a companion.
Keplerian orbital parameters of HD 103485.
Keplerian orbital parameters of BD+03 2562.
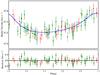 |
Fig. 5 Keplerian best fit to combined HET HRS (green points) and TNG HARPS-N (red points) data for HD 103485. The estimated jitter due to p-mode oscillations has been added to the uncertainties. |
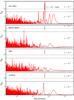 |
Fig. 6 From top to bottom: Lomb-Scarge periodograms for a) the original HET HRS and HARPS-N RV data of HD 103485, b) ASAS photometry, c) bisector analysis, and d) RV residua (HET and TNG) after the best Keplerian planet fit. |
5. Keplerian analysis
The Keplerian orbital parameters have been derived using a hybrid approach (e.g., Goździewski et al. 2003, 2007; Goździewski & Migaszewski 2006), in which the PIKAIA-based, global genetic algorithm (GA; Charbonneau 1995) was combined with the MPFit algorithm (Markwardt 2009) to find the best-fit Keplerian orbit delivered by RVLIN (Wright & Howard 2009) modified to allow the stellar jitter to be fitted as a free parameter (Ford & Gregory 2007; Johnson et al. 2011). The RV bootstrapping method (Murdoch et al. 1993; Kuerster et al. 1997; Marcy et al. 2005; Wright et al. 2007) is employed to assess the uncertainties of the best-fit orbital parameters (we refer to TAPAS I for more details). The results of the Keplerian analysis for HD 103485 are presented in Table 3 and in Fig. 5 and for BD+03 2562 in Table 4 and in Fig. 7.
 |
Fig. 7 Keplerian best fit to combined HET HRS and TNG HARPS-N data for BD+03 2562. The jitter is added to the uncertainties. |
6. Discussion and conclusions
In this paper, the fifth of our TAPAS series, we present a planetary mass companion to the giant star BD+03 2562 and a possible planet orbiting the giant star HD 103485. These two planets orbit two very-metal-poor giant stars in the constellation of Virgo. We have interpreted the RV variations measured in both stars as Keplerian motion. In the case of BD+03 2562 there is a lack of compelling evidence that the signal originates from stellar activity, but this is not so clear for HD 103485 for which, based on the available data, the interpretation of the RV signal as of planetary origin and activity are both possible. In the meantime, while more data is gathered for HD 103485, it is hard to justify or disprove both possible interpretations, so we maintain, as a working hypothesis for the following discussion, that the RV signal originates from a planet. In this case, both giant stars have masses close to Solar (1.11 M⊙ HD 103485 and 1.14 M⊙ BD+03 2562), very low metallicities ([ Fe / H ] = − 0.50 and − 0.71 for HD 103485 and BD+03 2562, respectively) and Jupiter planetary mass companions (m2sini = 7 and 6.4 MJ for HD 103485 and BD+03 2562 resp.) in close-to-terrestrial orbits (1.4 au HD 103485 and 1.3 au BD+03 2562) with moderate eccentricities (e = 0.34 and 0.2 for HD 103485 and BD+03 2562).
In Fig. 9 we show the location of all the stars included in the PTPS sample on the Hertzsprung-Russel (HR) diagram where we have marked the location of HD 103485 (blue) and BD+03 2562 (red) (and their corresponding uncertainties). The Bertelli et al. (2008) evolutionary tracks of a 1 M⊙ star at two different very low metallicities are also shown for comparison. From the figure is clear that the two stars presented in this paper are among the most evolved stars of the whole PTPS sample. With ages of 6.17 and 5.25 Gyr for HD 103485 and BD+03 2562 (see Tables 1 and 2), these stars are certainly above the mean age value of 3.37 Gyr obtained for giant stars with planets in Maldonado & Villaver (2016).
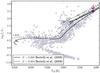 |
Fig. 9 Hertzsprung-Russell diagram for the complete PTPS sample with HD 103485 (in blue) and BD+03 2562 (in red) and the evolutionary tracks from Bertelli et al. (2008) for a star with 1 M⊙ and metallicities Z = 0.008 and Z = 0.004 (see the legend in the bottom left corner of the plot). |
Again under the interpretation that the RV signal measured in both stars is due to Keplerian motion and based on the derived orbital parameters we compute the orbital solution under stellar evolution. None of the planets are expected to have experienced orbital decay caused by stellar tides at their current location (with a/R⋆ = 10.99 and 8.64 for HD 103485 and BD+03 2562, respectively; e.g., Villaver & Livio 2009; Villaver et al. 2014). Given the tidal dissipation mode that operates in these giant stars, the planets should experience eccentricity decay together with orbital decay (Villaver et al. 2014), thus their moderate eccentricities and their a/R⋆ ratios are consistent with both planets still being too far from the star to have experience tidal forces. Both planets reported in this paper are located in similar regions in M⋆ versus orbital distance or the a − e plane to most of the other planets orbiting giant stars reported in the literature (Villaver et al. 2014). Neither HD 103485 b nor BD+03 2562 b are expected to survive engulfment when the star evolves up the tip of the RGB (Villaver & Livio 2009). Assuming an average value of sini, both these companions stay within the planetary-mass range.
Thus the orbital characteristics of the substellar object and the possible one we report in this paper do not appear to be different from the ones shown by the bulk population of planets found orbiting giant or subgiant stars. These two objects, however, clearly stand out in two important aspects: i) they are among the few very massive planets found around metal poor stars, and ii) BD+03 2562 in particular populates a region in the M⋆ − [ Fe / H ] ⋆ plane where only one other star has been found to host planets BD +20 2457 (Figs. 10 and 11).
From Figs. 10 and 11 it is clear that the two planet/star combinations reported in this paper are very special. First, they are two of the very few massive planets orbiting around stars close to the mass of the Sun to be found at very low metallicity. At lower metallicities than BD+03 2562, only two other planets have been reported in the literature orbiting the stars BD +20 2457 (Niedzielski et al. 2009) and HD 11755 (Lee et al. 2015). The similarities among these systems are striking: giant, close to solar mass evolved stars with radii close to 30 R⊙ and with ≈7 MJ minimum mass planets and in ≈1 au orbits. We note also that the planet around HD 103485 is the only massive planet in the region around stars with metallicity in the range − 0.6 < [ Fe / H ] ⋆< − 0.4. HD 103485 and BD+03 2562 stand out even more in Fig. 11 where very few planets are known with [Fe/H]⋆< − 0.48 and M⋆> 1M⊙.
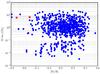 |
Fig. 10 Planet minimum mass (Msini in Jupiter mass) versus stellar metallicity ([Fe/H]) for all the confirmed planets (blue points) as taken from the Exoplanet encyclopedia (exoplanet.eu, exoplanets.org). The two red points represent the location of the planets reported in this paper. The horizontal lines are to guide the eye in the logarithmic scale in the vertical axis. |
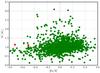 |
Fig. 11 Stellar mass (in M⊙ ) versus stellar metallicity ([Fe/H]) for all the stars with confirmed planets (green points) according to the Exoplanet encyclopedia (exoplanet.eu, exoplanets.org). The two red points represent the location of the stars reported in this paper. |
Our current understanding of massive-planet formation offers two channels. First, core accretion − and the growing of planets from the accretion of a gas envelope into a massive core − has difficulty in easily explaining systems formed at low metallicity. Models of planet formation by core accretion require a protoplanetary disk with a high density of solids to form planetary cores that accrete gas before the primordial gas disk dissipates (Ida & Lin 2004). The probability of a star hosting a planet that is detectable in radial velocity surveys increases Ppl(Z) = 0.03 × 10² × Z, where Z = [ Fe / H ] is the stellar metallicity between − 0.5 and 0.5 dex (Gonzalez 1997; Fischer & Valenti 2005). Thus although, core accretion does not exclude the formation at low metallicity, the probability of finding such planets is low Ppl = 0.2% for HD 103485 and 0.1% for BD+03 2562.
The alternative mechanism, in-situ fragmentation via gravitational instability (GI; e.g., Cameron 1978; Boss 1997), has such strong requirements concerning the characteristics of a protoplanetary disk at 1 au that it is regarded as implausible on dynamical grounds (e.g., Rafikov 2005; Stamatellos & Whitworth 2008). The planet could form by GI at larger distances (Rafikov 2005; Matzner & Levin 2005) and experience subsequent migration to ≈ 400 d orbital periods over relatively short timescales. In fact, the fragments formed by instability at 100 au are expected to have minimum masses of 10 MJ (Rafikov 2005), which is approximately the typical mass of the planets found around the low-metallicity stars reported in this paper. We note that although it has been shown that GI cannot be the main channel for planet formation as it cannot reproduce the overall characteristics of the bulk of the planet detections, nothing prevents it from being the preferred mechanism under certain circumstances. In fact, it has been reported that protoplanetary disks with low metallicities generally cool faster and show stronger overall GI activity (Mejía et al. 2005; Cai et al. 2006) although the lowest metallicity considered in these models is a quarter Solar (still much larger than the ones shown by the stars presented in this paper). So the questions still remain: How does the gas cooling in the disk operate at the low metallicity of these stars given that the disk needs to be atypically cold for GI? And do these planets represent indeed the low-mass tail of the distribution of disk-born companions (Kratter et al. 2010)?
Planet-hosting giants, in fact, have been reported to show peculiar characteristics regarding the planet-metallicity relation. In particular, Maldonado et al. (2013) show that, whilst the metallicity distribution of planet-hosting giant stars with stellar masses M> 1.5 M⊙ follows the general trend that has been established for main sequence stars hosting planets, giant planet hosts in the mass domain  do not show metal enrichment. Similar results were found by Mortier et al. (2013). We note that Reffert et al. (2015) challenged these results based on a discussion of planet contamination but it has been shown by Maldonado & Villaver (2016), based on their planet list, that the result is sustained using the Reffert et al. (2015) list of candidates.
The two objects presented in this paper add two more points to an already puzzling relation between giant planets and giant stars that might help understand planet-formation mechanisms for low-metallicity stars.
Acknowledgments
We thank the HET and IAC resident astronomers and telescope operators for their support. E.V. acknowledges support from the Spanish Ministerio de Economía y Competitividad under grant AYA2014-55840P. M.A. acknowledges the Mobility+III fellowship from the Polish Ministry of Science and Higher Education. A.N., B.D.-S. and M.I.A. were supported by the Polish National Science Centre grant No. UMO-2012/07/B/ST9/04415 and UMO-2015/19/B/ST9/02937. K.K. was funded in part by the Gordon and Betty Moore Foundation’s Data-Driven Discovery Initiative through Grant GBMF4561. This research was supported in part by PL-Grid Infrastructure. The HET is a joint project of the University of Texas at Austin, the Pennsylvania State University, Stanford University, Ludwig-Maximilians-Universität München, and Georg-August-Universität Göttingen. The HET is named in honor of its principal benefactors, William P. Hobby and Robert E. Eberly. The Center for Exoplanets and Habitable Worlds is supported by the Pennsylvania State University, the Eberly College of Science, and the Pennsylvania Space Grant Consortium. This work made use of NumPy (Walt et al. 2011), Matplotlib (Hunter 2007), Pandas (McKinney 2010) and yt (Turk et al. 2011) and of the Exoplanet Orbit Database and the ExoplanetData Explorer at exoplanets.org and exoplanet.eu.
References
- Adamczyk, M., Deka-Szymankiewicz, B., & Niedzielski, A. 2016, A&A, 587, A119 [NASA ADS] [CrossRef] [EDP Sciences] [Google Scholar]
- Adamów, M., Niedzielski, A., Villaver, E., Wolszczan, A., & Nowak, G. 2014, A&A, 569, A55 [NASA ADS] [CrossRef] [EDP Sciences] [Google Scholar]
- Adamów, M., M., Niedzielski, A., Villaver, E., et al. 2015, A&A, 581, A94 [NASA ADS] [CrossRef] [EDP Sciences] [Google Scholar]
- Baranne, A., Mayor, M., & Poncet, J. L. 1979, Vist. Astron., 23, 279 [NASA ADS] [CrossRef] [Google Scholar]
- Baranne, A., Queloz, D., Mayor, M., et al. 1996, A&AS, 119, 373 [NASA ADS] [CrossRef] [EDP Sciences] [Google Scholar]
- Bertelli, G., Girardi, L., Marigo, P., & Nasi, E. 2008, A&A, 484, 815 [NASA ADS] [CrossRef] [EDP Sciences] [Google Scholar]
- Boss, A. P. 1997, Science, 276, 1836 [NASA ADS] [CrossRef] [Google Scholar]
- Boss, A. P. 2004, ApJ, 610, 456 [NASA ADS] [CrossRef] [Google Scholar]
- Butler, R. P., Marcy, G. W., Williams, E., et al. 1996, PASP, 108, 500 [NASA ADS] [CrossRef] [Google Scholar]
- Cai, K., Durisen, R. H., Michael, S., et al. 2006, ApJ, 636, L149 [NASA ADS] [CrossRef] [Google Scholar]
- Cameron, A. G. W. 1978, Moon and Planets, 18, 5 [NASA ADS] [CrossRef] [EDP Sciences] [Google Scholar]
- Charbonneau, P. 1995, ApJS, 101, 309 [NASA ADS] [CrossRef] [Google Scholar]
- Cincunegui, C., Díaz, R. F., & Mauas, P. J. D. 2007, A&A, 469, 309 [NASA ADS] [CrossRef] [EDP Sciences] [Google Scholar]
- Cosentino, R., Lovis, C., Pepe, F., et al. 2012, SPIE Conf. Ser., 8446, 1 [Google Scholar]
- da Silva, L., Girardi, L., Pasquini, L., et al. 2006, A&A, 458, 609 [NASA ADS] [CrossRef] [EDP Sciences] [Google Scholar]
- Desort, M., Lagrange, A.-M., Galland, F., Udry, S., & Mayor, M. 2007, A&A, 473, 983 [NASA ADS] [CrossRef] [EDP Sciences] [Google Scholar]
- Duncan, D. K., Vaughan, A. H., Wilson, O. C., et al. 1991, ApJS, 76, 383 [NASA ADS] [CrossRef] [Google Scholar]
- Eberhard, G., & Schwarzschild, K. 1913, ApJ, 38, 292 [NASA ADS] [CrossRef] [Google Scholar]
- Fellgett, P. 1955, Opt. Acta, 2, 9 [NASA ADS] [CrossRef] [Google Scholar]
- Figueira, P., Faria, J. P., Adibekyan, V. Z., Oshagh, M., & Santos, N. C. 2016, Origins of Life and Evolution of the Biosphere, 46, 385 [CrossRef] [Google Scholar]
- Fischer, D. A., & Valenti, J. 2005, ApJ, 622, 1102 [NASA ADS] [CrossRef] [Google Scholar]
- Ford, E. B., & Gregory, P. C. 2007, in Statistical Challenges in Modern Astronomy IV, eds. G. J. Babu, & E. D. Feigelson, ASP Conf. Ser., 371, 189 [Google Scholar]
- Ghezzi, L., Cunha, K., Schuler, S. C., & Smith, V. V. 2010, ApJ, 725, 721 [NASA ADS] [CrossRef] [Google Scholar]
- Gomes da Silva, J., Santos, N. C., Bonfils, X., et al. 2012, A&A, 541, A9 [NASA ADS] [CrossRef] [EDP Sciences] [Google Scholar]
- Gonzalez, G. 1997, MNRAS, 285, 403 [NASA ADS] [CrossRef] [Google Scholar]
- Goździewski, K., & Migaszewski, C. 2006, A&A, 449, 1219 [NASA ADS] [CrossRef] [EDP Sciences] [Google Scholar]
- Goździewski, K., Konacki, M., & Maciejewski, A. J. 2003, ApJ, 594, 1019 [NASA ADS] [CrossRef] [Google Scholar]
- Goździewski, K., Maciejewski, A. J., & Migaszewski, C. 2007, ApJ, 657, 546 [NASA ADS] [CrossRef] [Google Scholar]
- Griffin, R. F. 1967, ApJ, 148, 465 [NASA ADS] [CrossRef] [Google Scholar]
- Hatzes, A. P. 2002, Astron. Nachr., 323, 392 [NASA ADS] [CrossRef] [Google Scholar]
- Høg, E., Fabricius, C., Makarov, V. V., et al. 2000, A&A, 355, L27 [NASA ADS] [Google Scholar]
- Hunter, J. D. 2007, Comp. Sci. Engin., 9, 90 [Google Scholar]
- Ida, S., & Lin, D. N. C. 2004, ApJ, 616, 567 [NASA ADS] [CrossRef] [MathSciNet] [Google Scholar]
- Jofré, E., Petrucci, R., Saffe, C., et al. 2015, A&A, 574, A50 [NASA ADS] [CrossRef] [EDP Sciences] [Google Scholar]
- Johnson, J. A., Clanton, C., Howard, A. W., et al. 2011, ApJS, 197, 26 [NASA ADS] [CrossRef] [Google Scholar]
- Jones, M. I., Jenkins, J. S., Bluhm, P., Rojo, P., & Melo, C. H. F. 2014, A&A, 566, A113 [NASA ADS] [CrossRef] [EDP Sciences] [Google Scholar]
- Kjeldsen, H., & Bedding, T. R. 1995, A&A, 293, 87 [NASA ADS] [Google Scholar]
- Kratter, K. M., Murray-Clay, R. A., & Youdin, A. N. 2010, ApJ, 710, 1375 [NASA ADS] [CrossRef] [Google Scholar]
- Kuerster, M., Schmitt, J. H. M. M., Cutispoto, G., & Dennerl, K. 1997, A&A, 320, 831 [NASA ADS] [Google Scholar]
- Lee, B.-C., Park, M.-G., Lee, S.-M., et al. 2015, A&A, 584, A79 [NASA ADS] [CrossRef] [EDP Sciences] [Google Scholar]
- Lomb, N. R. 1976, Ap&SS, 39, 447 [NASA ADS] [CrossRef] [Google Scholar]
- Lovis, C., Dumusque, X., Santos, N. C., et al. 2011, ArXiv e-prints [arXiv:1107.5325] [Google Scholar]
- Maciejewski, G., Niedzielski, A., Wolszczan, A., et al. 2013, AJ, 146, 147 [NASA ADS] [CrossRef] [Google Scholar]
- Maldonado, J., & Villaver, E. 2016, A&A, 588, A98 [NASA ADS] [CrossRef] [EDP Sciences] [Google Scholar]
- Maldonado, J., Villaver, E., & Eiroa, C. 2013, A&A, 554, A84 [NASA ADS] [CrossRef] [EDP Sciences] [Google Scholar]
- Marcy, G. W., & Butler, R. P. 1992, PASP, 104, 270 [NASA ADS] [CrossRef] [Google Scholar]
- Marcy, G. W., Butler, R. P., Vogt, S. S., et al. 2005, ApJ, 619, 570 [NASA ADS] [CrossRef] [Google Scholar]
- Markwardt, C. B. 2009, in Astronomical Data Analysis Software and Systems XVIII, eds. D. A. Bohlender, D. Durand, & P. Dowler, ASP Conf. Ser., 411, 251 [Google Scholar]
- Matzner, C. D., & Levin, Y. 2005, ApJ, 628, 817 [NASA ADS] [CrossRef] [Google Scholar]
- Mayer, L., Quinn, T., Wadsley, J., & Stadel, J. 2002, Science, 298, 1756 [NASA ADS] [CrossRef] [PubMed] [Google Scholar]
- Mayor, M., & Queloz, D. 1995, Nature, 378, 355 [NASA ADS] [CrossRef] [Google Scholar]
- McKinney, W. 2010, in Proc. 9th Python in Science Conf., eds. S. van der Walt, & J. Millman, 51 [Google Scholar]
- Mejía, A. C., Durisen, R. H., Pickett, M. K., & Cai, K. 2005, ApJ, 619, 1098 [NASA ADS] [CrossRef] [Google Scholar]
- Mizuno, H. 1980, Prog. Theor. Phys., 64, 544 [Google Scholar]
- Mordasini, C., Alibert, Y., Benz, W., Klahr, H., & Henning, T. 2012, A&A, 541, A97 [NASA ADS] [CrossRef] [EDP Sciences] [Google Scholar]
- Mortier, A., Santos, N. C., Sousa, S. G., et al. 2013, A&A, 557, A70 [NASA ADS] [CrossRef] [EDP Sciences] [Google Scholar]
- Murdoch, K. A., Hearnshaw, J. B., & Clark, M. 1993, ApJ, 413, 349 [NASA ADS] [CrossRef] [Google Scholar]
- Mustill, A. J., & Villaver, E. 2012, ApJ, 761, 121 [NASA ADS] [CrossRef] [Google Scholar]
- Niedzielski, A., & Wolszczan, A. 2008, in Extreme Solar Systems, eds. D. Fischer, F. A. Rasio, S. E. Thorsett, & A. Wolszczan, ASP Conf. Ser., 398, 71 [Google Scholar]
- Niedzielski, A., Konacki, M., Wolszczan, A., et al. 2007, ApJ, 669, 1354 [NASA ADS] [CrossRef] [Google Scholar]
- Niedzielski, A., Nowak, G., Adamów, M., & Wolszczan, A. 2009, ApJ, 707, 768 [NASA ADS] [CrossRef] [Google Scholar]
- Niedzielski, A., Villaver, E., Wolszczan, A., et al. 2015a, A&A, 573, A36 [NASA ADS] [CrossRef] [EDP Sciences] [Google Scholar]
- Niedzielski, A., Wolszczan, A., Nowak, G., et al. 2015b, ApJ, 803, 1 [Google Scholar]
- Niedzielski, A., Deka-Szymankiewicz, B., Adamczyk, M., et al. 2016a, A&A, 585, A73 [NASA ADS] [CrossRef] [EDP Sciences] [Google Scholar]
- Niedzielski, A., Villaver, E., Nowak, G., et al. 2016b, A&A, 588, A62 [NASA ADS] [CrossRef] [EDP Sciences] [Google Scholar]
- Niedzielski, A., Villaver, E., Nowak, G., et al. 2016c, A&A, 589, L1 [NASA ADS] [CrossRef] [EDP Sciences] [Google Scholar]
- Nowak, G. 2012, Ph.D. Thesis, Nicolaus Copernicus Univ., Toruń, Poland [Google Scholar]
- Nowak, G., Niedzielski, A., Wolszczan, A., Adamów, M., & Maciejewski, G. 2013, ApJ, 770, 53 [Google Scholar]
- Noyes, R. W., Hartmann, L. W., Baliunas, S. L., Duncan, D. K., & Vaughan, A. H. 1984, ApJ, 279, 763 [NASA ADS] [CrossRef] [Google Scholar]
- Pasquini, L., Döllinger, M. P., Weiss, A., et al. 2007, A&A, 473, 979 [NASA ADS] [CrossRef] [EDP Sciences] [Google Scholar]
- Pepe, F., Mayor, M., Galland, F., et al. 2002, A&A, 388, 632 [NASA ADS] [CrossRef] [EDP Sciences] [Google Scholar]
- Perri, F., & Cameron, A. G. W. 1974, Icarus, 22, 416 [NASA ADS] [CrossRef] [Google Scholar]
- Perryman, M. A. C., Lindegren, L., Kovalevsky, J., et al. 1997, A&A, 323, L49 [NASA ADS] [Google Scholar]
- Pojmanski, G. 1997, Acta Astron., 47, 467 [NASA ADS] [Google Scholar]
- Pollack, J. B., Hubickyj, O., Bodenheimer, P., et al. 1996, Icarus, 124, 62 [NASA ADS] [CrossRef] [Google Scholar]
- Press, W. H., Teukolsky, S. A., Vetterling, W. T., & Flannery, B. P. 1992, Numerical recipes in FORTRAN, The art of scientific computing (Cambridge University Press) [Google Scholar]
- Privitera, G., Meynet, G., Eggenberger, P., et al. 2016a, A&A, 593, L15 [Google Scholar]
- Privitera, G., Meynet, G., Eggenberger, P., et al. 2016b, A&A, 591, A45 [NASA ADS] [CrossRef] [EDP Sciences] [Google Scholar]
- Privitera, G., Meynet, G., Eggenberger, P., et al. 2016c, A&A, 593, A128 [NASA ADS] [CrossRef] [EDP Sciences] [Google Scholar]
- Queloz, D. 1995, in New Developments in Array Technology and Applications, eds. A. G. D. Philip, K. Janes, & A. R. Upgren, IAU Symp., 167, 221 [Google Scholar]
- Rafikov, R. R. 2005, ApJ, 621, L69 [NASA ADS] [CrossRef] [Google Scholar]
- Ramsey, L. W., Adams, M. T., Barnes, T. G., et al. 1998, ed. L. M. Stepp, in SPIE Conf. Ser., 3352, 34 [Google Scholar]
- Reffert, S., Bergmann, C., Quirrenbach, A., Trifonov, T., & Künstler, A. 2015, A&A, 574, A116 [NASA ADS] [CrossRef] [EDP Sciences] [Google Scholar]
- Robertson, P., Endl, M., Cochran, W. D., & Dodson-Robinson, S. E. 2013, ApJ, 764, 3 [NASA ADS] [CrossRef] [Google Scholar]
- Saar, S. H., & Donahue, R. A. 1997, ApJ, 485, 319 [NASA ADS] [CrossRef] [Google Scholar]
- Santos, N. C., Israelian, G., & Mayor, M. 2004, A&A, 415, 1153 [NASA ADS] [CrossRef] [EDP Sciences] [Google Scholar]
- Scargle, J. D. 1982, ApJ, 263, 835 [NASA ADS] [CrossRef] [Google Scholar]
- Shetrone, M., Cornell, M. E., Fowler, J. R., et al. 2007, PASP, 119, 556 [NASA ADS] [CrossRef] [Google Scholar]
- Simon, J. B., Armitage, P. J., Li, R., & Youdin, A. N. 2016, ApJ, 822, 55 [Google Scholar]
- Stamatellos, D., & Whitworth, A. P. 2008, A&A, 480, 879 [NASA ADS] [CrossRef] [EDP Sciences] [Google Scholar]
- Tull, R. G. 1998, in SPIE Conf. Ser., ed. S. D’Odorico, 3355, 387 [Google Scholar]
- Turk, M. J., Smith, B. D., Oishi, J. S., et al. 2011, ApJS, 192, 9 [NASA ADS] [CrossRef] [Google Scholar]
- Udry, S., & Santos, N. C. 2007, ARA&A, 45, 397 [NASA ADS] [CrossRef] [Google Scholar]
- van Leeuwen, F. 2007, A&A, 474, 653 [NASA ADS] [CrossRef] [EDP Sciences] [Google Scholar]
- Villaver, E., & Livio, M. 2007, ApJ, 661, 1192 [NASA ADS] [CrossRef] [Google Scholar]
- Villaver, E., & Livio, M. 2009, ApJ, 705, L81 [NASA ADS] [CrossRef] [Google Scholar]
- Villaver, E., Livio, M., Mustill, A. J., & Siess, L. 2014, ApJ, 794, 3 [NASA ADS] [CrossRef] [Google Scholar]
- Walt, S. v. d., Colbert, S. C., & Varoquaux, G. 2011, Comp. Sci. Eng., 13, 22 [Google Scholar]
- Wright, J. T., & Howard, A. W. 2009, ApJS, 182, 205 [NASA ADS] [CrossRef] [Google Scholar]
- Wright, J. T., Marcy, G. W., Fischer, D. A., et al. 2007, ApJ, 657, 533 [NASA ADS] [CrossRef] [Google Scholar]
- Youdin, A. N. 2011, ApJ, 731, 99 [NASA ADS] [CrossRef] [Google Scholar]
- Zieliński, P., Niedzielski, A., Wolszczan, A., Adamów, M., & Nowak, G. 2012, A&A, 547, A91 [NASA ADS] [CrossRef] [EDP Sciences] [Google Scholar]
Appendix A: Additional table
HET and HRS RV and BIS measurements (m s-1) of HD 103485.
TNG and HARPS-N RV and BIS measurements (m s-1) of HD 103485.
HET and HRS RV and BIS measurements (m s-1) of BD+03 2562.
TNG and HARPS-N RV and BIS measurements (m s-1) of BD+03 2562
All Tables
All Figures
|
Fig. 1 Hα activity index of HD 103485 measured from TNG/HARPS-N spectra (top panel) and from HET/HRS ones (lower panel). Solid lines present linear fits to the data. Although Hα activity index measured from HET/HRS does not present correlation with HET/HRS radial velocities, the one measured from TNG/HARPS-N spectra shows clear correlation with TNG/HARPS-N radial velocities. |
| In the text | |
|
Fig. 2 TNG/HARPS-N radial velocity and Hα activity index curves of HD 103485. |
| In the text | |
|
Fig. 3 LS periodograms of a) TNG/HARPS-N RVs, b) TNG/HARPS-N Hα activity index, c) HET/HRS RVs, and d) HET/HRS Hα activity index of HD 103485. The levels of FAP = 1.0% and 0.1% are shown. |
| In the text | |
|
Fig. 4 Radial velocity peak-to-peak amplitude (A) as a function of TNG/HARPS-N order number. |
| In the text | |
|
Fig. 5 Keplerian best fit to combined HET HRS (green points) and TNG HARPS-N (red points) data for HD 103485. The estimated jitter due to p-mode oscillations has been added to the uncertainties. |
| In the text | |
|
Fig. 6 From top to bottom: Lomb-Scarge periodograms for a) the original HET HRS and HARPS-N RV data of HD 103485, b) ASAS photometry, c) bisector analysis, and d) RV residua (HET and TNG) after the best Keplerian planet fit. |
| In the text | |
|
Fig. 7 Keplerian best fit to combined HET HRS and TNG HARPS-N data for BD+03 2562. The jitter is added to the uncertainties. |
| In the text | |
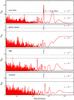 |
Fig. 8 Same as Fig. 6 but for BD+03 2562. |
| In the text | |
|
Fig. 9 Hertzsprung-Russell diagram for the complete PTPS sample with HD 103485 (in blue) and BD+03 2562 (in red) and the evolutionary tracks from Bertelli et al. (2008) for a star with 1 M⊙ and metallicities Z = 0.008 and Z = 0.004 (see the legend in the bottom left corner of the plot). |
| In the text | |
|
Fig. 10 Planet minimum mass (Msini in Jupiter mass) versus stellar metallicity ([Fe/H]) for all the confirmed planets (blue points) as taken from the Exoplanet encyclopedia (exoplanet.eu, exoplanets.org). The two red points represent the location of the planets reported in this paper. The horizontal lines are to guide the eye in the logarithmic scale in the vertical axis. |
| In the text | |
|
Fig. 11 Stellar mass (in M⊙ ) versus stellar metallicity ([Fe/H]) for all the stars with confirmed planets (green points) according to the Exoplanet encyclopedia (exoplanet.eu, exoplanets.org). The two red points represent the location of the stars reported in this paper. |
| In the text | |
Current usage metrics show cumulative count of Article Views (full-text article views including HTML views, PDF and ePub downloads, according to the available data) and Abstracts Views on Vision4Press platform.
Data correspond to usage on the plateform after 2015. The current usage metrics is available 48-96 hours after online publication and is updated daily on week days.
Initial download of the metrics may take a while.